Panera Bread 2014 Annual Report Download - page 37
Download and view the complete annual report
Please find page 37 of the 2014 Panera Bread annual report below. You can navigate through the pages in the report by either clicking on the pages listed below, or by using the keyword search tool below to find specific information within the annual report.-
 1
1 -
2
-
3
-
4
-
5
-
6
-
7
-
8
-
9
-
10
-
11
-
12
-
13
-
14
-
15
-
16
-
17
-
18
-
19
-
20
-
21
-
22
-
23
-
24
-
25
-
26
-
 27
27 -
 28
28 -
 29
29 -
 30
30 -
 31
31 -
 32
32 -
 33
33 -
 34
34 -
 35
35 -
 36
36 -
 37
37 -
 38
38 -
 39
39 -
 40
40 -
 41
41 -
 42
42 -
 43
43 -
 44
44 -
 45
45 -
 46
46 -
 47
47 -
48
-
49
-
50
-
51
-
52
-
53
-
54
-
55
-
56
-
57
-
58
-
59
-
60
-
61
-
62
-
63
-
64
-
65
-
66
-
67
-
68
-
69
-
70
-
71
-
72
-
73
-
74
-
75
-
76
-
77
-
78
-
79
-
80
-
81
-
82
-
83
-
84
-
85
-
86
-
87
-
88
 |
 |

25
For the fiscal year ended
December 30,
2014
December 31,
2013
December 25,
2012
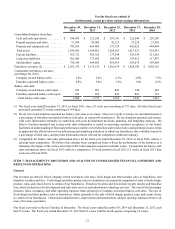
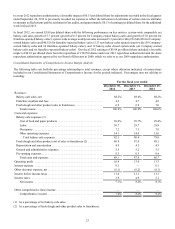
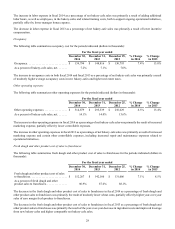
Price . . . . . . . . . . . . . . . . . . . . . . . . . . . . . . . . . . . . . . . . . . . . . . . . . . . . . . . . 1.0% 1.8 % 3.0%
Mix . . . . . . . . . . . . . . . . . . . . . . . . . . . . . . . . . . . . . . . . . . . . . . . . . . . . . . . . . 0.3% 2.0 % 2.7%
Average check . . . . . . . . . . . . . . . . . . . . . . . . . . . . . . . . . . . . . . . . . . . . . . 1.3% 3.8 % 5.7%
Transactions . . . . . . . . . . . . . . . . . . . . . . . . . . . . . . . . . . . . . . . . . . . . . . . . 0.1% (1.2)% 0.8%
Company-owned comparable net bakery-cafe sales growth . . . . . . . . . 1.4% 2.6 % 6.5%
Price growth in fiscal 2014 was modest, generally due to our decision to take minimal price increases in anticipation of expected
modest inflation. Mix was modest in fiscal 2014 due to slower catering sales growth and an increase in breakfast transactions,
which generally carry a lower average check than lunch or dinner transactions. Transactions were generally flat during fiscal 2014
due primarily to an increase in transactions during the breakfast and lunch dayparts, which were largely offset by a continued
challenging consumer environment, intensified competition and severe weather in the first quarter of fiscal 2014.
Results of Operations
Revenues
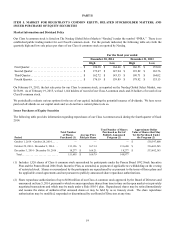
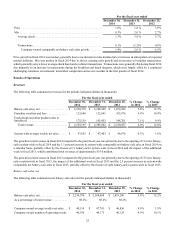
The following table summarizes revenues for the periods indicated (dollars in thousands):
For the fiscal year ended
December 30,
2014
December 31,
2013
December 25,
2012
% Change
in 2014
% Change
in 2013
Bakery-cafe sales, net . . . . . . . . . . . . . . . . . . . $ 2,230,370 $ 2,108,908 $ 1,879,280 5.8% 12.2%
Franchise royalties and fees . . . . . . . . . . . . . . 123,686 112,641 102,076 9.8% 10.4%
Fresh dough and other product sales to
franchisees. . . . . . . . . . . . . . . . . . . . . . . . . . . . 175,139 163,453 148,701 7.1% 9.9%
Total revenue . . . . . . . . . . . . . . . . . . . . . . . $ 2,529,195 $ 2,385,002 $ 2,130,057 6.0% 12.0%
System-wide average weekly net sales . . . . . . $ 47,655 $ 47,403 $ 46,676 0.5% 1.6%
The growth in total revenues in fiscal 2014 compared to the prior fiscal year was primarily due to the opening of 114 new bakery-
cafes system-wide in fiscal 2014 and the 1.1 percent increase in system-wide comparable net bakery-cafe sales in fiscal 2014 on
a calendar basis, partially offset by the closure of 11 bakery-cafes system-wide in fiscal 2014 and the impact of the additional
week in fiscal 2013, which contributed total revenues of approximately $35.0 million.
The growth in total revenues in fiscal 2013 compared to the prior fiscal year was primarily due to the opening of 133 new bakery-
cafes system-wide in fiscal 2013, the impact of the additional week in fiscal 2013 and the 2.3 percent increase in system-wide
comparable net bakery-cafe sales in fiscal 2013, partially offset by the closure of eight bakery-cafes system-wide in fiscal 2013.
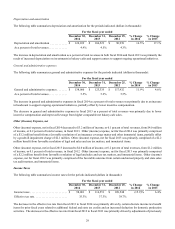
Bakery-cafe sales, net
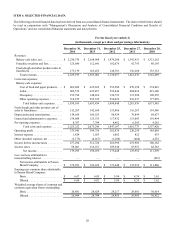
The following table summarizes net bakery-cafe sales for the periods indicated (dollars in thousands):
For the fiscal year ended
December 30,
2014
December 31,
2013
December 25,
2012
% Change
in 2014
% Change
in 2013
Bakery-cafe sales, net . . . . . . . . . . . . . . . . . . . $ 2,230,370 $ 2,108,908 $ 1,879,280 5.8% 12.2%
As a percentage of total revenue . . . . . . . . . . . 88.2% 88.4% 88.2%
Company-owned average weekly net sales. . . $ 48,114 $ 47,741 $ 46,836 0.8% 1.9%
Company-owned number of operating weeks 46,356 44,173 40,125 4.9% 10.1%