Panera Bread 2014 Annual Report Download - page 71
Download and view the complete annual report
Please find page 71 of the 2014 Panera Bread annual report below. You can navigate through the pages in the report by either clicking on the pages listed below, or by using the keyword search tool below to find specific information within the annual report.-
 1
1 -
2
-
3
-
4
-
5
-
6
-
7
-
8
-
9
-
10
-
11
-
12
-
13
-
14
-
15
-
16
-
17
-
18
-
19
-
20
-
21
-
22
-
23
-
24
-
25
-
26
-
27
-
28
-
29
-
30
-
31
-
32
-
33
-
34
-
35
-
36
-
37
-
38
-
39
-
40
-
41
-
42
-
43
-
44
-
45
-
46
-
47
-
48
-
49
-
50
-
51
-
52
-
53
-
54
-
55
-
56
-
57
-
58
-
59
-
60
-
 61
61 -
 62
62 -
 63
63 -
 64
64 -
 65
65 -
 66
66 -
 67
67 -
 68
68 -
 69
69 -
 70
70 -
 71
71 -
 72
72 -
 73
73 -
 74
74 -
 75
75 -
 76
76 -
 77
77 -
 78
78 -
 79
79 -
 80
80 -
 81
81 -
82
-
83
-
84
-
85
-
86
-
87
-
88
 |
 |

PANERA BREAD COMPANY
NOTES TO THE CONSOLIDATED FINANCIAL STATEMENTS (continued)
59
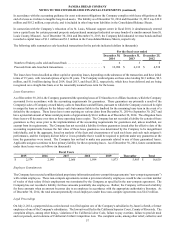
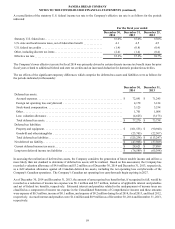
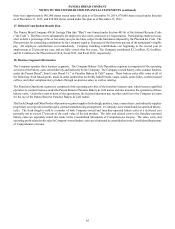
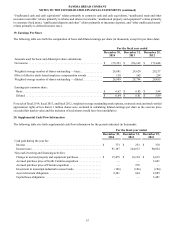
A reconciliation of the statutory U.S. federal income tax rate to the Company's effective tax rate is as follows for the periods
indicated:
For the fiscal year ended
December 30,
2014
December 31,
2013
December 25,
2012
Statutory U.S. federal rate. . . . . . . . . . . . . . . . . . . . . . . . . . . . . . . . . . . . . . . . 35.0% 35.0% 35.0%
U.S. state and local income taxes, net of federal tax benefit . . . . . . . . . . . . . 4.1 4.5 4.5
U.S. federal tax credits . . . . . . . . . . . . . . . . . . . . . . . . . . . . . . . . . . . . . . . . . . (1.4)(0.8)(0.4)
Other, including discrete tax items . . . . . . . . . . . . . . . . . . . . . . . . . . . . . . . . . (2.4)(1.4)(0.4)
Effective tax rate . . . . . . . . . . . . . . . . . . . . . . . . . . . . . . . . . . . . . . . . . . . . . . . 35.3% 37.3% 38.7%
The Company’s lower effective tax rate for fiscal 2014 was primarily driven by certain discrete income tax benefit items for prior
fiscal years related to additional federal and state tax credits and an increased deduction for domestic production activities.
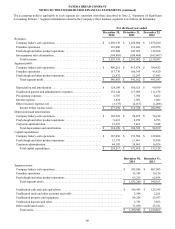
The tax effects of the significant temporary differences which comprise the deferred tax assets and liabilities were as follows for
the periods indicated (in thousands):
December 30,
2014
December 31,
2013
Deferred tax assets:
Accrued expenses. . . . . . . . . . . . . . . . . . . . . . . . . . . . . . . . . . . . . . . . . . . . . . . . . . . . . . . . . . . $ 72,891 $ 71,245
Foreign net operating loss carryforward . . . . . . . . . . . . . . . . . . . . . . . . . . . . . . . . . . . . . . . . . 4,178 3,124
Stock-based compensation . . . . . . . . . . . . . . . . . . . . . . . . . . . . . . . . . . . . . . . . . . . . . . . . . . . . 3,125 3,534
Other. . . . . . . . . . . . . . . . . . . . . . . . . . . . . . . . . . . . . . . . . . . . . . . . . . . . . . . . . . . . . . . . . . . . . 1,701 1,008
Less: valuation allowance . . . . . . . . . . . . . . . . . . . . . . . . . . . . . . . . . . . . . . . . . . . . . . . . . . . . (4,625)(3,173)
Total deferred tax assets. . . . . . . . . . . . . . . . . . . . . . . . . . . . . . . . . . . . . . . . . . . . . . . . . . . . . . $ 77,270 $ 75,738
Deferred tax liabilities:
Property and equipment . . . . . . . . . . . . . . . . . . . . . . . . . . . . . . . . . . . . . . . . . . . . . . . . . . . . . . $(101,533)$ (90,940)
Goodwill and other intangibles . . . . . . . . . . . . . . . . . . . . . . . . . . . . . . . . . . . . . . . . . . . . . . . . (23,705)(22,307)
Total deferred tax liabilities . . . . . . . . . . . . . . . . . . . . . . . . . . . . . . . . . . . . . . . . . . . . . . . . . . . $(125,238)$ (113,247)
Net deferred tax liability. . . . . . . . . . . . . . . . . . . . . . . . . . . . . . . . . . . . . . . . . . . . . . . . . . . . . . . $(47,968)$ (37,509)
Current deferred income tax assets. . . . . . . . . . . . . . . . . . . . . . . . . . . . . . . . . . . . . . . . . . . . . . . $ 28,621 $ 27,889
Long-term deferred income tax liabilities . . . . . . . . . . . . . . . . . . . . . . . . . . . . . . . . . . . . . . . . . $(76,589)$ (65,398)
In assessing the realization of deferred tax assets, the Company considers the generation of future taxable income and utilizes a
more likely than not standard to determine if deferred tax assets will be realized. Based on this assessment, the Company has
recorded a valuation allowance of $4.6 million and $3.2 million as of December 30, 2014 and December 31, 2013, respectively,
as a full valuation allowance against all Canadian deferred tax assets, including the net operating loss carryforwards of the
Company's Canadian operations. The Company’s Canadian net operating loss carryforwards begin expiring in 2027.
As of December 30, 2014 and December 31, 2013, the amount of unrecognized tax benefits that, if recognized in full, would be
recorded as a reduction of income tax expense was $6.1 million and $2.7 million, inclusive of applicable interest and penalties
and net of federal tax benefits, respectively. Estimated interest and penalties related to the underpayment of income taxes are
classified as a component of income tax expense in the Consolidated Statements of Comprehensive Income and these amounts
were expense of $0.3 million, income of $0.1 million, and expense of $0.2 million during fiscal 2014, fiscal 2013, and fiscal 2012,
respectively. Accrued interest and penalties were $1.4 million and $0.9 million as of December 30, 2014 and December 31, 2013,
respectively.