Panera Bread 2014 Annual Report Download - page 35
Download and view the complete annual report
Please find page 35 of the 2014 Panera Bread annual report below. You can navigate through the pages in the report by either clicking on the pages listed below, or by using the keyword search tool below to find specific information within the annual report.-
 1
1 -
2
-
3
-
4
-
5
-
6
-
7
-
8
-
9
-
10
-
11
-
12
-
13
-
14
-
15
-
16
-
17
-
18
-
19
-
20
-
21
-
22
-
23
-
24
-
 25
25 -
 26
26 -
 27
27 -
 28
28 -
 29
29 -
 30
30 -
 31
31 -
 32
32 -
 33
33 -
 34
34 -
 35
35 -
 36
36 -
 37
37 -
 38
38 -
 39
39 -
 40
40 -
 41
41 -
 42
42 -
 43
43 -
 44
44 -
 45
45 -
46
-
47
-
48
-
49
-
50
-
51
-
52
-
53
-
54
-
55
-
56
-
57
-
58
-
59
-
60
-
61
-
62
-
63
-
64
-
65
-
66
-
67
-
68
-
69
-
70
-
71
-
72
-
73
-
74
-
75
-
76
-
77
-
78
-
79
-
80
-
81
-
82
-
83
-
84
-
85
-
86
-
87
-
88
 |
 |

23
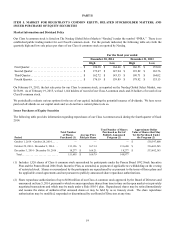
to as our 2012 repurchase authorization, a favorable impact of $0.13 per diluted share for adjustments recorded in the fiscal quarter
ended September 24, 2013 to previously recorded tax expense to reflect the refinement of estimates of certain state tax attributes
to amounts in filed returns and the settlement of tax audits, and approximately $0.13 of earnings per diluted share for the additional
week in fiscal 2013.
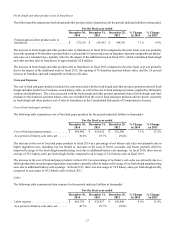
In fiscal 2012, we earned $5.89 per diluted share with the following performance on key metrics: system-wide comparable net
bakery-cafe sales growth of 5.7 percent (growth of 6.5 percent for Company-owned bakery-cafes and growth of 5.0 percent for
franchise-operated bakery-cafes); system-wide average weekly net sales increased 5.3 percent to $46,676 ($46,836 for Company-
owned bakery-cafes and $46,526 for franchise-operated bakery-cafes); 123 new bakery-cafes opened system-wide (59 Company-
owned bakery-cafes and 64 franchise-operated bakery-cafes); and 12 bakery-cafes closed system-wide (six Company-owned
bakery-cafes and six franchise-operated bakery-cafes). Our fiscal 2012 earnings of $5.89 per diluted share included a favorable
impact of $0.01 per diluted share from the repurchase of 158,700 shares under our 2012 repurchase authorization and the share
repurchase authorization approved by our Board of Directors in 2009, which we refer to as our 2009 repurchase authorization.
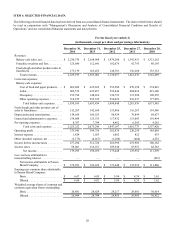
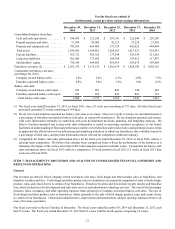
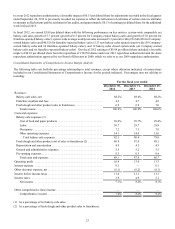
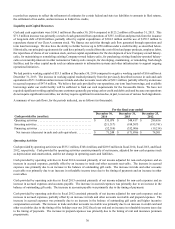
Consolidated Statements of Comprehensive Income Margin Analysis
The following table sets forth the percentage relationship to total revenues, except where otherwise indicated, of certain items
included in our Consolidated Statements of Comprehensive Income for the periods indicated. Percentages may not add due to
rounding:
For the fiscal year ended
December 30,
2014
December 31,
2013
December 25,
2012
Revenues:
Bakery-cafe sales, net 88.2% 88.4% 88.2%
Franchise royalties and fees . . . . . . . . . . . . . . . . . . . . . . . . . . . . . . . . . . . . . 4.9 4.7 4.8
Fresh dough and other product sales to franchisees . . . . . . . . . . . . . . . . . . . 6.9 6.9 7.0
Total revenue . . . . . . . . . . . . . . . . . . . . . . . . . . . . . . . . . . . . . . . . . . . . . . 100.0% 100.0% 100.0%
Costs and expenses:
Bakery-cafe expenses (1):
Cost of food and paper products . . . . . . . . . . . . . . . . . . . . . . . . . . . . . . . 30.0% 29.7% 29.4%
Labor . . . . . . . . . . . . . . . . . . . . . . . . . . . . . . . . . . . . . . . . . . . . . . . . . . . . 30.7 29.7 29.8
Occupancy . . . . . . . . . . . . . . . . . . . . . . . . . . . . . . . . . . . . . . . . . . . . . . . . 7.2 7.1 7.0
Other operating expenses. . . . . . . . . . . . . . . . . . . . . . . . . . . . . . . . . . . . . 14.1 14.0 13.6
Total bakery-cafe expenses. . . . . . . . . . . . . . . . . . . . . . . . . . . . . . . . . 82.1 80.4 79.8
Fresh dough and other product cost of sales to franchisees (2) . . . . . . . . . . 86.9 87.0 88.1
Depreciation and amortization . . . . . . . . . . . . . . . . . . . . . . . . . . . . . . . . . . . 4.9 4.5 4.3
General and administrative expenses . . . . . . . . . . . . . . . . . . . . . . . . . . . . . . 5.5 5.2 5.5
Pre-opening expenses . . . . . . . . . . . . . . . . . . . . . . . . . . . . . . . . . . . . . . . . . . 0.3 0.3 0.4
Total costs and expenses . . . . . . . . . . . . . . . . . . . . . . . . . . . . . . . . . . . . . 89.1 87.0 86.7
Operating profit. . . . . . . . . . . . . . . . . . . . . . . . . . . . . . . . . . . . . . . . . . . . . . . . 10.9 13.0 13.3
Interest expense. . . . . . . . . . . . . . . . . . . . . . . . . . . . . . . . . . . . . . . . . . . . . . . . 0.1 — 0.1
Other (income) expense, net . . . . . . . . . . . . . . . . . . . . . . . . . . . . . . . . . . . . . . (0.1)(0.2)(0.1)
Income before income taxes . . . . . . . . . . . . . . . . . . . . . . . . . . . . . . . . . . . . . . 11.0 13.1 13.3
Income taxes . . . . . . . . . . . . . . . . . . . . . . . . . . . . . . . . . . . . . . . . . . . . . . . . . . 3.9 4.9 5.1
Net income. . . . . . . . . . . . . . . . . . . . . . . . . . . . . . . . . . . . . . . . . . . . . . . . 7.1% 8.2% 8.1%
Other comprehensive (loss) income . . . . . . . . . . . . . . . . . . . . . . . . . . . . . . . . — — —
Comprehensive income . . . . . . . . . . . . . . . . . . . . . . . . . . . . . . . . . . . . . . 7.0% 8.2% 8.2%
(1) As a percentage of net bakery-cafe sales.
(2) As a percentage of fresh dough and other product sales to franchisees.