Panera Bread 2014 Annual Report Download - page 40
Download and view the complete annual report
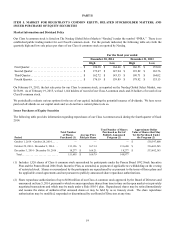
Please find page 40 of the 2014 Panera Bread annual report below. You can navigate through the pages in the report by either clicking on the pages listed below, or by using the keyword search tool below to find specific information within the annual report.-
 1
1 -
2
-
3
-
4
-
5
-
6
-
7
-
8
-
9
-
10
-
11
-
12
-
13
-
14
-
15
-
16
-
17
-
18
-
19
-
20
-
21
-
22
-
23
-
24
-
25
-
26
-
27
-
28
-
29
-
 30
30 -
 31
31 -
 32
32 -
 33
33 -
 34
34 -
 35
35 -
 36
36 -
 37
37 -
 38
38 -
 39
39 -
 40
40 -
 41
41 -
 42
42 -
 43
43 -
 44
44 -
 45
45 -
 46
46 -
 47
47 -
 48
48 -
 49
49 -
 50
50 -
51
-
52
-
53
-
54
-
55
-
56
-
57
-
58
-
59
-
60
-
61
-
62
-
63
-
64
-
65
-
66
-
67
-
68
-
69
-
70
-
71
-
72
-
73
-
74
-
75
-
76
-
77
-
78
-
79
-
80
-
81
-
82
-
83
-
84
-
85
-
86
-
87
-
88
 |
 |

28
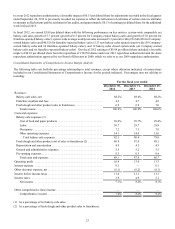
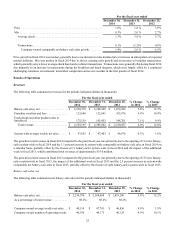
The increase in labor expense in fiscal 2014 as a percentage of net bakery-cafe sales was primarily a result of adding additional
labor hours, as well as employees, in the bakery-cafes and related training costs, both to support ongoing operational initiatives,
partially offset by lower manager bonus expense.
The decrease in labor expense in fiscal 2013 as a percentage of net bakery-cafe sales was primarily a result of lower incentive
compensation.
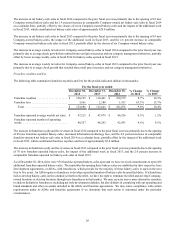
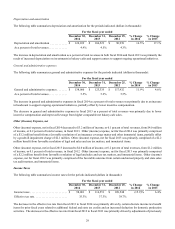
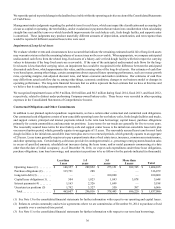
Occupancy
The following table summarizes occupancy cost for the periods indicated (dollars in thousands):
For the fiscal year ended
December 30,
2014
December 31,
2013
December 25,
2012
% Change
in 2014
% Change
in 2013
Occupancy. . . . . . . . . . . . . . . . . . . . . . . . . . . . $ 159,794 $ 148,816 $ 130,793 7.4% 13.8%
As a percent of bakery-cafe sales, net. . . . . . . 7.2% 7.1% 7.0%
The increase in occupancy costs in both fiscal 2014 and fiscal 2013 as a percentage of net bakery-cafe sales was primarily a result
of modestly higher average occupancy costs in new bakery-cafes and higher real estate taxes.
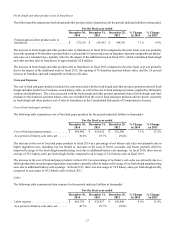
Other operating expenses
The following table summarizes other operating expenses for the periods indicated (dollars in thousands):
For the fiscal year ended
December 30,
2014
December 31,
2013
December 25,
2012
% Change
in 2014
% Change
in 2013
Other operating expenses . . . . . . . . . . . . . . . . $ 314,879 $ 295,539 $ 256,029 6.5% 15.4%
As a percent of bakery-cafe sales, net. . . . . . . 14.1% 14.0% 13.6%
The increase in other operating expenses in fiscal 2014 as a percentage of net bakery-cafe sales was primarily the result of increased
marketing expense, partially offset by lower controllable expenses.
The increase in other operating expenses in fiscal 2013 as a percentage of net bakery-cafe sales was primarily a result of increased
marketing expense and certain other controllable expenses, including increased repair and maintenance expenses related to
operational initiatives.
Fresh dough and other product cost of sales to franchisees
The following table summarizes fresh dough and other product cost of sales to franchisees for the periods indicated (dollars in
thousands):
For the fiscal year ended
December 30,
2014
December 31,
2013
December 25,
2012
% Change
in 2014
% Change
in 2013
Fresh dough and other product cost of sales
to franchisees. . . . . . . . . . . . . . . . . . . . . . . . . . $ 152,267 $ 142,160 $ 131,006 7.1% 8.5%
As a percent of fresh dough and other
product sales to franchisees. . . . . . . . . . . . . . . 86.9% 87.0% 88.1%
The decrease in the fresh dough and other product cost of sales to franchisees in fiscal 2014 as a percentage of fresh dough and
other product sales to franchisees was primarily the result of modestly lower wheat costs, partially offset by higher year-over-year
sales of zero margin fresh produce to franchisees.
The decrease in the fresh dough and other product cost of sales to franchisees in fiscal 2013 as a percentage of fresh dough and
other product sales to franchisees was primarily the result of the year-over-year decrease in ingredient costs and improved leverage
from new bakery-cafes and higher comparable net bakery-cafe sales.