Panera Bread 2014 Annual Report Download - page 42
Download and view the complete annual report
Please find page 42 of the 2014 Panera Bread annual report below. You can navigate through the pages in the report by either clicking on the pages listed below, or by using the keyword search tool below to find specific information within the annual report.-
 1
1 -
2
-
3
-
4
-
5
-
6
-
7
-
8
-
9
-
10
-
11
-
12
-
13
-
14
-
15
-
16
-
17
-
18
-
19
-
20
-
21
-
22
-
23
-
24
-
25
-
26
-
27
-
28
-
29
-
30
-
31
-
 32
32 -
 33
33 -
 34
34 -
 35
35 -
 36
36 -
 37
37 -
 38
38 -
 39
39 -
 40
40 -
 41
41 -
 42
42 -
 43
43 -
 44
44 -
 45
45 -
 46
46 -
 47
47 -
 48
48 -
 49
49 -
 50
50 -
 51
51 -
 52
52 -
53
-
54
-
55
-
56
-
57
-
58
-
59
-
60
-
61
-
62
-
63
-
64
-
65
-
66
-
67
-
68
-
69
-
70
-
71
-
72
-
73
-
74
-
75
-
76
-
77
-
78
-
79
-
80
-
81
-
82
-
83
-
84
-
85
-
86
-
87
-
88
 |
 |

30
recorded tax expense to reflect the refinement of estimates for certain federal and state tax liabilities to amounts in filed returns,
the settlement of tax audits, and an increase in federal tax credits.
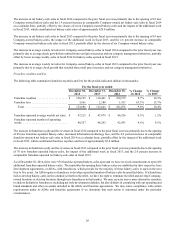
Liquidity and Capital Resources
Cash and cash equivalents were $196.5 million at December 30, 2014 compared to $125.2 million at December 31, 2013. This
$71.3 million increase was primarily a result of cash generated from operations of $335.1 million and proceeds from the issuance
of long-term debt of $100 million, partially offset by capital expenditures of $224.2 million and the use of $159.5 million to
repurchase shares of our Class A common stock. We finance our activities through cash flow generated through operations and
term loan borrowings. We also have the ability to further borrow up to $250 million under a credit facility, as described below.
Historically, our principal requirements for cash have primarily resulted from the cost of food and paper products, employee labor,
the repurchase of shares of our common stock, and our capital expenditures for the development of new Company-owned bakery-
cafes, for maintaining or remodeling existing Company-owned bakery-cafes, for purchasing existing franchise-operated bakery-
cafes or ownership interests in other restaurant or bakery-cafe concepts, for developing, maintaining, or remodeling fresh dough
facilities, and for other capital needs such as enhancements to information systems and other infrastructure to support ongoing
operational initiatives.
We had positive working capital of $53.5 million at December 30, 2014 compared to negative working capital of $0.6 million at
December 31, 2013. The increase in working capital resulted primarily from the previously described increase in cash and cash
equivalents of $71.3 million and an increase in trade and other accounts receivable of $22.1 million, partially offset by an increase
in accrued expenses of $47.4 million. We believe that cash provided by our operations, our term loan borrowings, and available
borrowings under our credit facility will be sufficient to fund our cash requirements for the foreseeable future. We have not
required significant working capital because customers generally pay using cash or credit and debit cards and because our operations
do not require significant receivables, nor do they require significant inventories due, in part, to our use of various fresh ingredients.
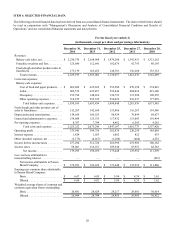
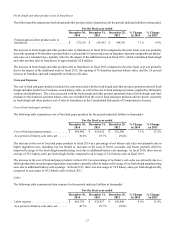
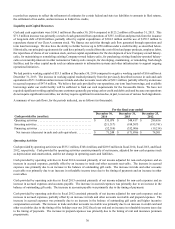
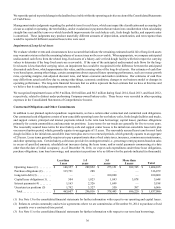
A summary of our cash flows, for the periods indicated, are as follows (in thousands):
For the fiscal year ended
Cash provided by (used in):
December 30,
2014
December 31,
2013
December 25,
2012
Operating activities . . . . . . . . . . . . . . . . . . . . . . . . . . . . . . . . . . . . . $ 335,079 $ 348,417 $ 289,456
Investing activities . . . . . . . . . . . . . . . . . . . . . . . . . . . . . . . . . . . . . . (211,317)(188,307)(195,741)
Financing activities . . . . . . . . . . . . . . . . . . . . . . . . . . . . . . . . . . . . . (52,514)(332,006)(19,214)
Net increase (decrease) in cash and cash equivalents . . . . . . . . . . $ 71,248 $ (171,896) $ 74,501
Operating Activities
Cash provided by operating activities was $335.1 million, $348.4 million, and $289.5 million in fiscal 2014, fiscal 2013, and fiscal
2012, respectively. Cash provided by operating activities consists primarily of net income, adjusted for non-cash expenses such
as depreciation and amortization, and the net change in operating assets and liabilities.
Cash provided by operating activities in fiscal 2014 consisted primarily of net income adjusted for non-cash expenses and an
increase in accrued expenses, partially offset by an increase in trade and other accounts receivable. The increase in accrued
expenses was primarily due to an increase in the balance of outstanding gift cards. The increase in trade and other accounts
receivable was primarily due to an increase in refundable income taxes due to the timing of payments and an increase in other
receivables.
Cash provided by operating activities in fiscal 2013 consisted primarily of net income adjusted for non-cash expenses and an
increase in accrued expenses and accounts payable. The increase in accrued expenses was primarily due to an increase in the
balance of outstanding gift cards. The increase in accounts payable was primarily due to the timing of payments.
Cash provided by operating activities in fiscal 2012 consisted primarily of net income adjusted for non-cash expenses and an
increase in accrued expenses, partially offset by an increase in trade and other accounts receivable and prepaid expenses. The
increase in accrued expenses was primarily due to an increase in the balance of outstanding gift cards and higher incentive
compensation accruals. The increase in trade and other accounts receivable was primarily due to an increase in credit card and
other receivables due to the timing of the holidays near our 2012 fiscal year end and an increase in refundable income taxes due
to the timing of payments. The increase in prepaid expenses was primarily due to the timing of rent and insurance premium
prepayments.