Nordstrom 2008 Annual Report Download - page 56
Download and view the complete annual report
Please find page 56 of the 2008 Nordstrom annual report below. You can navigate through the pages in the report by either clicking on the pages listed below, or by using the keyword search tool below to find specific information within the annual report.-
 1
1 -
2
-
3
-
4
-
5
-
6
-
7
-
8
-
9
-
10
-
11
-
12
-
13
-
14
-
15
-
16
-
17
-
18
-
19
-
20
-
21
-
22
-
23
-
24
-
25
-
26
-
27
-
28
-
29
-
30
-
31
-
32
-
33
-
34
-
35
-
36
-
37
-
38
-
39
-
40
-
41
-
42
-
43
-
44
-
45
-
 46
46 -
 47
47 -
 48
48 -
 49
49 -
 50
50 -
 51
51 -
 52
52 -
 53
53 -
 54
54 -
 55
55 -
 56
56 -
 57
57 -
 58
58 -
 59
59 -
 60
60 -
 61
61 -
 62
62 -
 63
63 -
 64
64 -
 65
65 -
 66
66
 |
 |

56
Nordstrom, Inc.
Notes to Consolidated Financial Statements
Dollar and share amounts in millions except per share and per option amounts
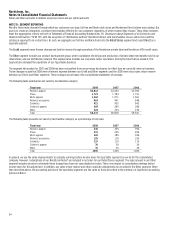
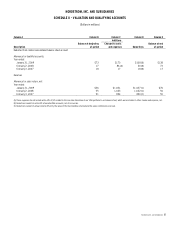
NOTE 16: SELECTED QUARTERLY DATA (UNAUDITED)
Fiscal year 2008 1st Quarter 2nd Quarter 3rd Quarter 4th Quarter Total
Net sales $1,879 $2,287 $1,805 $2,301 $8,272
Same-store sales
percentage change (6.5%) (6.0%) (11.1%) (12.5%) (9.0%)
Credit card revenues 70 72 74 85 301
Gross profit1 700 799 620 736 2,855
Selling, general and administrative expenses:
Retail stores, direct and other segments 494 547 490 580 2,111
Credit segment 51 57 77 90 275
Other income and expense, net 2 2 — 5 9
Earnings before income taxes 196 235 94 123 648
Net earnings 119 143 71 68 401
Net earnings as a percentage of
net sales 6.3% 6.3% 3.9% 3.0% 4.8%
Earnings per basic share $0.54 $0.66 $0.33 $0.32 $1.85
Earnings per diluted share $0.54 $0.65 $0.33 $0.31 $1.83
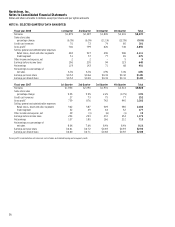
Fiscal year 2007 1st Quarter 2nd Quarter 3rd Quarter 4th Quarter Total
Net sales $1,954 $2,390 $1,970 $2,514 $8,828
Same-store sales
percentage change 9.5% 5.9% 2.2% (0.7%) 3.9%
Credit card revenues 27 73 75 77 252
Gross profit1 739 876 742 945 3,302
Selling, general and administrative expenses:
Retail stores, direct and other segments 502 587 509 585 2,183
Credit segment 32 49 44 52 177
Other income and expense, net 29 (3) (6) (1) 19
Earnings before income taxes 254 293 272 354 1,173
Net earnings 157 180 166 212 715
Net earnings as a percentage of
net sales 8.0% 7.6% 8.4% 8.4% 8.1%
Earnings per basic share $0.61 $0.72 $0.69 $0.93 $2.92
Earnings per diluted share $0.60 $0.71 $0.68 $0.92 $2.88
1Gross profit is calculated as net sales less cost of sales and related buying and occupancy costs.