Nordstrom 2008 Annual Report Download - page 21
Download and view the complete annual report
Please find page 21 of the 2008 Nordstrom annual report below. You can navigate through the pages in the report by either clicking on the pages listed below, or by using the keyword search tool below to find specific information within the annual report.-
 1
1 -
2
-
3
-
4
-
5
-
6
-
7
-
8
-
9
-
10
-
 11
11 -
 12
12 -
 13
13 -
 14
14 -
 15
15 -
 16
16 -
 17
17 -
 18
18 -
 19
19 -
 20
20 -
 21
21 -
 22
22 -
 23
23 -
 24
24 -
 25
25 -
 26
26 -
 27
27 -
 28
28 -
 29
29 -
 30
30 -
 31
31 -
32
-
33
-
34
-
35
-
36
-
37
-
38
-
39
-
40
-
41
-
42
-
43
-
44
-
45
-
46
-
47
-
48
-
49
-
50
-
51
-
52
-
53
-
54
-
55
-
56
-
57
-
58
-
59
-
60
-
61
-
62
-
63
-
64
-
65
-
66
 |
 |

Nordstrom, Inc. and subsidiaries 21
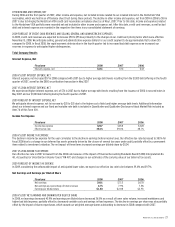
OTHER INCOME AND EXPENSE, NET
During 2006 and the first quarter of 2007, other income and expense, net included income related to our retained interest in the Nordstrom VISA
receivables, which was held in an off-balance sheet trust during these periods. The decline in other income and expense, net from $109 in 2006 to $18 in
2007 is due to bringing the Nordstrom VISA credit card receivables on-balance sheet as of May 1, 2007. Prior to this date, income and expenses related
to the Nordstrom VISA portfolio were recorded net and included in other income and expense, net. After this date, credit card revenues, as well as bad
debt and interest expense are recorded in the respective line items in our consolidated statement of earnings.
2009 FORECAST OF CREDIT CARD REVENUES AND SELLING, GENERAL AND ADMINISTRATIVE EXPENSES
In 2009, credit card revenues are expected to increase $50 to $55 due primarily to the changes in our credit card pricing terms which were effective
November 15, 2008. We anticipate selling, general and administrative expense dollars for our credit segment to be approximately flat to down $15
compared to 2008. In fiscal 2008, the rapid economic deterioration in the fourth quarter led to increased bad debt expense as we increased our
reserves in response to anticipated higher delinquencies.
Total Company Results
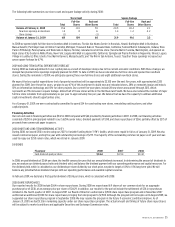
Interest Expense, Net
Fiscal year 2008 2007 2006
Interest expense, net $131 $74 $43
2008 VS 2007 INTEREST EXPENSE, NET
Interest expense, net increased $57 in 2008 compared with 2007 due to higher average debt levels resulting from the $1,000 debt offering in the fourth
quarter of 2007, as well as the $850 securitization transaction in May 2007.
2007 VS 2006 INTEREST EXPENSE, NET
We experienced higher interest expense, net, of $74 in 2007 due to higher average debt levels resulting from the issuance of $850 in secured notes in
May 2007 and our $1,000 debt offering during the fourth quarter of 2007.
2009 FORECAST OF INTEREST EXPENSE, NET
We anticipate interest expense, net to increase by $20 to $25 due to the higher cost of debt and higher average debt levels. Additional information
about our interest expense and our fixed and variable rate debt is included in Quantitative and Qualitative Disclosures About Market Risk included as
Item 7A of this Form 10-K.
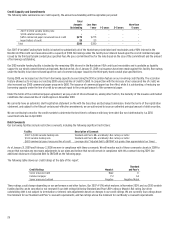
Income Tax Expense
Fiscal year 2008 2007 2006
Income tax expense $247 $458 $428
Effective tax rate 38.1% 39.0% 38.7%
2008 VS 2007 INCOME TAX EXPENSE
The decline in income tax expense for the year correlates to the decline in earnings before income taxes. Our effective tax rate decreased to 38.1% for
fiscal 2008 due to a change in our deferred tax assets primarily driven by the closure of several tax years under audit, partially offset by a permanent
item related to investment valuation. The net impact of these items increased earnings per diluted share by $0.04.
2007 VS 2006 INCOME TAX EXPENSE
Our effective tax rate in 2007 increased from the 2006 rate because of the impact of Financial Accounting Standards Board (FASB) Interpretation No.
48,
Accounting for Uncertainty in Income Taxes
(“FIN 48”) and changes in our estimates of the carrying value of our deferred tax assets.
2009 FORECAST OF INCOME TAX EXPENSE
In 2009, considering the unfavorable impact of anticipated lower sales, we expect our effective tax rate to be between 39.4% and 39.7%.
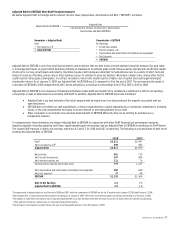
Net Earnings and Earnings per Diluted Share
Fiscal year 2008 2007 2006
Net earnings $401 $715 $678
Net earnings as a percentage of total revenues 4.7% 7.9% 7.8%
Earnings per diluted share $1.83 $2.88 $2.55
2008 VS 2007 NET EARNINGS AND EARNINGS PER DILUTED SHARE
In 2008, net earnings decreased 43.9% and earnings per diluted share decreased 36.5% as a result of lower sales volume, increased markdowns and
higher bad debt expense, partially offset by decreased variable costs and savings in fixed expenses. The decline in earnings per share was also partially
offset by the impact of share repurchases, which caused our weighted average shares outstanding to decrease in 2008 compared with 2007.