Nordstrom 2008 Annual Report Download - page 37
Download and view the complete annual report
Please find page 37 of the 2008 Nordstrom annual report below. You can navigate through the pages in the report by either clicking on the pages listed below, or by using the keyword search tool below to find specific information within the annual report.-
 1
1 -
2
-
3
-
4
-
5
-
6
-
7
-
8
-
9
-
10
-
11
-
12
-
13
-
14
-
15
-
16
-
17
-
18
-
19
-
20
-
21
-
22
-
23
-
24
-
25
-
26
-
 27
27 -
 28
28 -
 29
29 -
 30
30 -
 31
31 -
 32
32 -
 33
33 -
 34
34 -
 35
35 -
 36
36 -
 37
37 -
 38
38 -
 39
39 -
 40
40 -
 41
41 -
 42
42 -
 43
43 -
 44
44 -
 45
45 -
 46
46 -
 47
47 -
48
-
49
-
50
-
51
-
52
-
53
-
54
-
55
-
56
-
57
-
58
-
59
-
60
-
61
-
62
-
63
-
64
-
65
-
66
 |
 |

Nordstrom, Inc. and subsidiaries 37
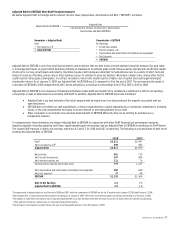
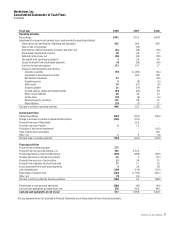
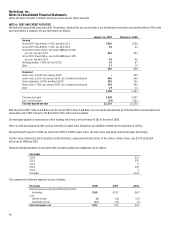
Nordstrom, Inc.
Consolidated Statements of Cash Flows
In millions
Fiscal year 2008 2007 2006
Operating Activities
Net earnings $401 $715 $678
Adjustments to reconcile net earnings to net cash provided by operating activities:
Depreciation and amortization of buildings and equipment 302 269 285
Gain on sale of Façonnable — (34) —
Amortization of deferred property incentives and other, net (21) (36) (36)
Stock-based compensation expense 28 26 37
Deferred income taxes, net (36) (42) (58)
Tax benefit from stock-based payments 3 28 44
Excess tax benefit from stock-based payments (4) (26) (38)
Provision for bad debt expense 173 107 17
Change in operating assets and liabilities:
Accounts receivable (93) (1,083) (61)
Investment in asset backed securities — 420 128
Merchandise inventories 53 — (39)
Prepaid expenses 9 (9) (5)
Other assets 29 (27) (8)
Accounts payable 16 (19) 84
Accrued salaries, wages and related benefits (54) (64) 49
Other current liabilities 28 36 23
Income taxes (76) (6) (6)
Deferred property incentives 119 58 31
Other liabilities (29) (1) 17
Net cash provided by operating activities 848 312 1,142
Investing Activities
Capital expenditures (563) (501) (264)
Change in accounts receivable originated at third parties (232) (151) —
Proceeds from sale of Façonnable — 216 —
Proceeds from sale of assets 2 12 —
Purchases of short-term investments — — (110)
Sales of short-term investments — — 164
Other, net 1 3 (8)
Net cash used in investing activities (792) (421) (218)
Financing Activities
Proceeds from commercial paper 275 — —
Proceeds from long-term borrowings, net 150 2,510 —
Principal payments on long-term borrowings (410) (680) (307)
Increase (decrease) in cash book overdrafts 20 5 (51)
Proceeds from exercise of stock options 13 34 51
Proceeds from employee stock purchase plan 17 17 16
Excess tax benefit from stock-based payments 4 26 38
Cash dividends paid (138) (134) (110)
Repurchase of common stock (264) (1,702) (621)
Other, net (9) (12) —
Net cash (used in) provided by financing activities (342) 64 (984)
Net decrease in cash and cash equivalents (286) (45) (60)
Cash and cash equivalents at beginning of year 358 403 463
Cash and cash equivalents at end of year $72 $358 $403
The accompanying Notes to Consolidated Financial Statements are an integral part of these financial statements.