Nordstrom 2008 Annual Report Download - page 19
Download and view the complete annual report
Please find page 19 of the 2008 Nordstrom annual report below. You can navigate through the pages in the report by either clicking on the pages listed below, or by using the keyword search tool below to find specific information within the annual report.-
 1
1 -
2
-
3
-
4
-
5
-
6
-
7
-
8
-
 9
9 -
 10
10 -
 11
11 -
 12
12 -
 13
13 -
 14
14 -
 15
15 -
 16
16 -
 17
17 -
 18
18 -
 19
19 -
 20
20 -
 21
21 -
 22
22 -
 23
23 -
 24
24 -
 25
25 -
 26
26 -
 27
27 -
 28
28 -
 29
29 -
30
-
31
-
32
-
33
-
34
-
35
-
36
-
37
-
38
-
39
-
40
-
41
-
42
-
43
-
44
-
45
-
46
-
47
-
48
-
49
-
50
-
51
-
52
-
53
-
54
-
55
-
56
-
57
-
58
-
59
-
60
-
61
-
62
-
63
-
64
-
65
-
66
 |
 |

Nordstrom, Inc. and subsidiaries 19
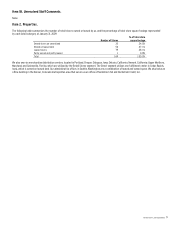
Credit Segment
The Nordstrom Credit card products are designed to grow retail sales and customer relationships by providing superior payment products, services and
loyalty benefits. We believe that owning our credit card business allows us to fully integrate our rewards program with our retail stores and provide
superior service and experience to our customers, thus deepening our relationship with customers and driving higher levels of long-term customer
loyalty. Each card enables participation in the Nordstrom Fashion Rewards® program, through which the customer accumulates points based on their
level of spending (two points per dollar spent at Nordstrom and one point per dollar spent outside of Nordstrom stores). Upon reaching two thousand
points, customers receive twenty dollars in Nordstrom Notes®, which can be redeemed for goods or services in our stores. As customers increase their
level of spending they receive additional benefits, including rewards such as complimentary shipping and alterations in our retail stores. We believe the
Fashion Rewards program, including these additional rewards, drives sales in our Retail Stores and Direct segments.
The table below illustrates a detailed view of the operational results of our Credit segment, consistent with the segment disclosure provided in the
notes to the consolidated financial statements. In order to view the total economic contribution of our credit card program, the following items are
also included in the table below:
• During 2007, we combined our Nordstrom private label credit card and Nordstrom VISA credit card programs into one securitization
program. At this time the Nordstrom VISA credit card receivables were brought on-balance sheet. While the underlying economics of the
business did not change (Nordstrom has always owned 100% of its Credit segment), the accounting for this business segment did change.
For comparability between years, off-balance sheet income (expense), net (credit card revenues, net of bad debt and interest expense) is
shown to mitigate the impact of the change in accounting.
• Intercompany merchant fees represents the estimated intercompany income of our credit business from the usage of our cards in the
Retail Stores and Direct segments. To encourage the use of Nordstrom cards in our stores, the Credit segment does not charge the Retail
Stores and Direct segments an interchange merchant fee. On a consolidated basis, we avoid these costs which would be incurred if our
customers used third-party cards.
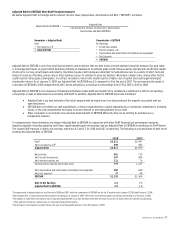
Fiscal year 2008 2007 2006
Finance charge revenue $215
$194 $96
Late fees and other revenue 18 12 9
Interchange 69 47 -
Total credit card revenues 302 253 105
Interest expense (50) (64) (37)
Net credit card income
252 189 68
Cost of sales — loyalty program (50) (47) (38)
Selling, general and administrative expenses1 (275) (198) (92)
Total expense (325) (245) (130)
Other income and expense, net1 1 18 109
Credit card (charge) contribution to earnings before income tax
expense, as presented in segment disclosure (72) (38) 47
Off-balance sheet income (expense), net2 - 9 (6)
Intercompany merchant fees 48 48 43
Total credit card (charge) contribution $(24) $19 $84
Average accounts receivable investment (assuming 80% of accounts
receivable is funded with debt)
$382
$332
$283
Credit card (charge) contribution, net of tax, as a percentage of average
accounts receivable investment
(3.9%) 3.5% 18.1%
1In 2007, the one-time transitional charge-offs on the Nordstrom VISA receivables of $21 are included in other income and expense, net on our consolidated statement of earnings.
In the above disclosure this amount is included in selling, general and administrative expenses. These charge-offs represent actual write-offs on the Nordstrom VISA credit card
portfolio during the eight-month transitional period.
2Includes off-balance sheet finance charges and other income of $22 in 2007 and $37 in 2006, off-balance sheet interest expense of $6 in 2007 and $21 in 2006, and off-balance sheet bad
debt expense of $7 in 2007 and $22 in 2006.
CREDIT CARD REVENUES
Credit card revenues include finance charges, late and other fees, and interchange fees. The majority of our credit accounts have finance charge rates
that vary with changes in the prime rate. Interchange fees are earned from the use of Nordstrom VISA cards at merchants outside of Nordstrom.
Credit card revenues increased from $253 in 2007 to $302 in 2008 in part due to the Nordstrom VISA portfolio being on-balance sheet for a full year in
fiscal 2008 compared to only three quarters in fiscal 2007, as well as overall portfolio growth. During the first three quarters of fiscal 2008, the positive
impact we saw on finance charge revenue as a result of portfolio growth was partially offset by a significant reduction in the average prime rate as
most of our Nordstrom private label and VISA cards have annual percentage rate terms that are tied to the prime rate. However, during the fourth
quarter of 2008, finance charge revenues improved slightly due to a change in our credit card pricing terms effective November 15, 2008.
The increase in credit card revenues from $105 in 2006 to $253 in 2007 is due to bringing the Nordstrom VISA portfolio on-balance sheet as of May 1,
2007, as well as portfolio growth year over year.