Nordstrom 2008 Annual Report Download - page 16
Download and view the complete annual report
Please find page 16 of the 2008 Nordstrom annual report below. You can navigate through the pages in the report by either clicking on the pages listed below, or by using the keyword search tool below to find specific information within the annual report.
16
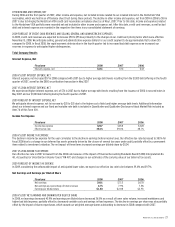
Retail Stores, Direct and Other Segments
Summary
Fiscal year 2008 2007 2006
Net sales $8,272
$8,828 $8,561
Cost of sales and related buying and occupancy costs (5,367) (5,479) (5,316)
Gross profit1 2,905
3,349 3,245
Selling, general and administrative expenses (2,111) (2,183) (2,205)
% of net sales:
Cost of sales and related buying and occupancy costs 64.9% 62.1% 62.1%
Gross profit 35.1% 37.9% 37.9%
Selling, general and administrative expenses 25.5% 24.7% 25.8%
1Gross profit is calculated as net sales less Retail Stores, Direct and Other segment cost of sales and related buying and occupancy costs.
Net Sales
Fiscal year 2008 2007 2006
Net sales $8,272
$8,828 $8,561
Net sales (decrease) increase
(6.3%) 3.1% 10.8%
Same-store sales (decrease) increase
(9.0%)
3.9% 7.5%
Sales (decrease) increase by channel:
Full-line same-store sales
(12.4%) 2.5% 5.9%
Rack same-store sales 3.1% 8.7% 10.9%
Net sales – Direct 8.4% 17.9% 24.7%
Percentage of net sales by merchandise category:
Women’s apparel 34% 35% 35%
Shoes 21% 20% 20%
Men’s apparel 16% 18% 18%
Women’s accessories 12% 11% 10%
Cosmetics 11% 11% 11%
Children’s apparel 3% 3% 3%
Other 3% 2% 3%
Total 100% 100% 100%
2008 VS 2007 NET SALES
Net sales declined 6.3% in 2008 compared to 2007. The decrease was due to same-store sales declines in our full-line stores, partially offset by
increases in same-store sales for Rack and Direct, as well as new store openings.
Same-store sales for our full-line stores decreased 12.4% compared to the same period last year. The largest same-store sales decreases came in
women’s apparel and men’s apparel. Women’s apparel continues to experience a market-wide downturn and we have seen a decline in men’s apparel
correspond to the economic downturn, particularly during the fourth quarter. Regionally, business trends were most challenging in markets undergoing
the largest housing price corrections. California was the most challenging region throughout 2008, with same-store sales below the full-line store
average. All other regions were above the same-store sales average for full-line stores.
Our Rack channel had its seventh consecutive year of positive sales growth with a same-store sales increase of 3.1% for the year. Rack purchases
merchandise from third parties and also serves as a clearance channel for our full-line stores. The accessories and men’s apparel categories drove this
growth. Designer handbags led accessories and premium denim led men’s apparel. All regions contributed to the positive same-store sales results.
Our Direct channel net sales increased 8.4% for the year, with results driven by accessories, women’s apparel and kids’ merchandise categories.
The growth in our Direct business was driven by our efforts to better align our merchandise offering and experience with our full-line stores. Our new
“Buy Online, Pick Up in Store” service proved to be a convenient and valued service for our customers over the holiday gift-giving season.
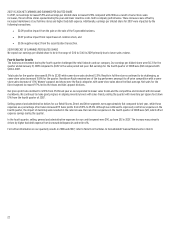
During 2008 we opened eight new full-line and six new Rack stores. These new stores represent 3.3% of our total net sales for fiscal 2008, and
increased our gross square footage by 6.7% during 2008.
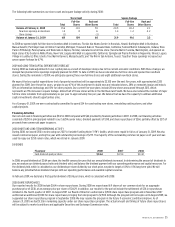
2007 VS 2006 NET SALES
Total net sales increased 3.1% as a result of same-store sales increases as well as from the three full-line stores and one Rack store opened during
fiscal 2007. The 2006 fiscal calendar had 53 weeks compared to our normal operating calendar of 52 weeks. In the 53rd week of 2006, we had sales
of $118. Excluding the extra week of sales in fiscal 2006, total sales increased 4.6% in fiscal year 2007. The 53rd week is not included in same-store
sales calculations.


