Nordstrom 2008 Annual Report Download - page 55
Download and view the complete annual report
Please find page 55 of the 2008 Nordstrom annual report below. You can navigate through the pages in the report by either clicking on the pages listed below, or by using the keyword search tool below to find specific information within the annual report.-
 1
1 -
2
-
3
-
4
-
5
-
6
-
7
-
8
-
9
-
10
-
11
-
12
-
13
-
14
-
15
-
16
-
17
-
18
-
19
-
20
-
21
-
22
-
23
-
24
-
25
-
26
-
27
-
28
-
29
-
30
-
31
-
32
-
33
-
34
-
35
-
36
-
37
-
38
-
39
-
40
-
41
-
42
-
43
-
44
-
 45
45 -
 46
46 -
 47
47 -
 48
48 -
 49
49 -
 50
50 -
 51
51 -
 52
52 -
 53
53 -
 54
54 -
 55
55 -
 56
56 -
 57
57 -
 58
58 -
 59
59 -
 60
60 -
 61
61 -
 62
62 -
 63
63 -
 64
64 -
 65
65 -
66
 |
 |

Nordstrom, Inc. and subsidiaries 55
Nordstrom, Inc.
Notes to Consolidated Financial Statements
Dollar and share amounts in millions except per share and per option amounts
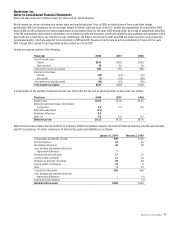
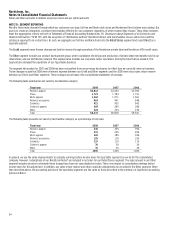
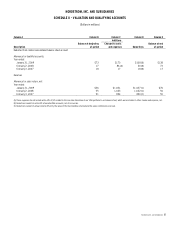
The following tables set forth the information for our reportable segments:
Retail
Fiscal year 2008 Stores Direct Credit Other Total
Net sales (a) $7,674 $698 — $(100) $8,272
Net sales (decrease) increase (5.9%) 8.4% N/A N/A (6.3%)
Credit card revenue — — 302 (1) 301
Other income and expense, net (5) — 1 13 9
Interest expense, net (b) — — (50) (81) (131)
Depreciation and amortization 259 8 1 34 302
Earnings before income taxes 884 187 (72) (351) 648
Earnings before income taxes
as a percentage of net sales 11.5% 26.8% N/A N/A 7.8%
Goodwill 38 15 — — 53
Assets (c) 2,740 123 1,963 835 5,661
Capital expenditures 529 15 2 17 563
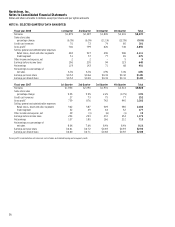
Retail
Fiscal year 2007 Stores Direct Credit Other Total
Net sales (a) $8,159 $644 — $25 $8,828
Net sales increase 3.1% 17.9% N/A N/A 3.1%
Credit card revenue — — 253 (1) 252
Other income and expense, net (1) — (3) 23 19
Interest expense, net (b) — — (64) (10) (74)
Depreciation and amortization 228 3 1 37 269
Earnings before income taxes 1,256 165 (38) (210) 1,173
Earnings before income taxes
as a percentage of net sales 15.4% 25.6% N/A N/A 13.3%
Goodwill 38 15 — — 53
Assets (c) 2,555 133 1,783 1,129 5,600
Capital expenditures 431 35 3 32 501
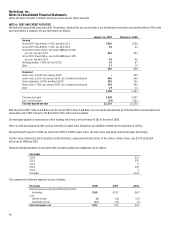
Retail
Fiscal year 2006 Stores Direct Credit Other Total
Net sales (a) $7,912 $546 - $103 $8,561
Net sales increase 9.9% 24.7% N/A N/A 10.8%
Credit card revenue — — 105 - 105
Other income and expense, net (1) — 109 26 134
Interest expense, net (b) — — (37) (6) (43)
Depreciation and amortization 237 3 1 44 285
Earnings before income taxes 1,204 134 47 (279) 1,106
Earnings before income taxes
as a percentage of net sales 15.2% 24.5% N/A N/A 12.9%
Goodwill 8 16 - 28 52
Acquired tradename — — - 84 84
Assets (c) 2,306 105 1,063 1,348 4,822
Capital expenditures 224 3 1 36 264
(a) Net sales in Other include foreign sales of $0, $62 and $104 for 2008, 2007 and 2006.
(b) Interest income of $2, $14 and $13 for 2008, 2007 and 2006 is recorded in our Other segment as an offset to interest expense, net.
(c) Assets in Other include foreign assets of $212 at the end of 2006. There were no material foreign assets at the end of 2008 or 2007. Assets in Other also include unallocated assets in
corporate headquarters, consisting primarily of cash, land, buildings and equipment, and deferred tax assets.