Nordstrom 2008 Annual Report Download - page 14
Download and view the complete annual report
Please find page 14 of the 2008 Nordstrom annual report below. You can navigate through the pages in the report by either clicking on the pages listed below, or by using the keyword search tool below to find specific information within the annual report.-
 1
1 -
2
-
3
-
 4
4 -
 5
5 -
 6
6 -
 7
7 -
 8
8 -
 9
9 -
 10
10 -
 11
11 -
 12
12 -
 13
13 -
 14
14 -
 15
15 -
 16
16 -
 17
17 -
 18
18 -
 19
19 -
 20
20 -
 21
21 -
 22
22 -
 23
23 -
 24
24 -
25
-
26
-
27
-
28
-
29
-
30
-
31
-
32
-
33
-
34
-
35
-
36
-
37
-
38
-
39
-
40
-
41
-
42
-
43
-
44
-
45
-
46
-
47
-
48
-
49
-
50
-
51
-
52
-
53
-
54
-
55
-
56
-
57
-
58
-
59
-
60
-
61
-
62
-
63
-
64
-
65
-
66
 |
 |

14
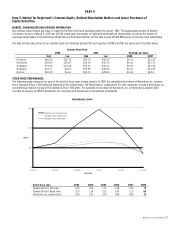
Item 6. Selected Financial Data.
(Dollars in millions except sales per square foot and per share amounts)
The following selected financial data are derived from the audited Consolidated Financial Statements and should be read in conjunction with Item 1A
“Risk Factors,” Item 7 “Management’s Discussion and Analysis of Financial Condition and Results of Operations,” and the Consolidated Financial
Statements and related notes included in Item 8 of this Annual Report on Form 10-K.
Fiscal year
2008
20076
2006
2005
2004
Operations
Net sales $8,272 $8,828 $8,561 $7,723 $7,131
Same-store sales percentage (decrease) increase1 (9.0%) 3.9% 7.5% 6.0% 8.5%
Credit card revenues2 301 252 105 97 102
Gross profit3 2,855 3,302 3,207 2,835 2,572
Gross profit rate4 34.5% 37.4% 37.5% 36.7% 36.1%
Selling, general and administrative expenses:2
Retail stores, direct and other segments2 (2,111) (2,183) (2,205) (2,016) (1,934)
Retail stores, direct and other segments rate4 25.5% 24.7% 25.8% 26.1% 27.1%
Credit segment2 (275) (177) (92) (85) (86)
Total selling, general and administrative rate4 28.8% 26.7% 26.8% 27.2% 28.3%
Other income and expense, net2 9 19 134 99 71
Earnings before interest and income taxes (“EBIT”) 779 1,247 1,149 930 725
EBIT as a percentage of total revenues 9.1% 13.7% 13.3% 11.9% 10.0%
Interest expense, net (131) (74) (43) (45) (78)
Earnings before income taxes (“EBT”) 648 1,173 1,106 885 647
EBT as a percentage of total revenues 7.6% 12.9% 12.8% 11.3% 8.9%
Net earnings 401 715 678 551 393
Net earnings as a percentage of total revenues 4.7% 7.9% 7.8% 7.1% 5.4%
Earnings per diluted share $1.83 $2.88 $2.55 $1.98 $1.38
Dividends per share $0.64 $0.54 $0.42 $0.32 $0.24
Return on average shareholders’ equity 34.5% 43.6% 31.8% 28.4% 23.0%
Sales per square foot5 $388 $435 $423 $392 $369
Financial Position (at year end)
Customer accounts receivable, net $1,881 $1,705 $609 $567 $580
Investment in asset backed securities - - 428 561 422
Merchandise inventories 900 956 997 956 917
Current assets 3,217 3,361 2,742 2,874 2,572
Current liabilities 1,601 1,635 1,433 1,623 1,341
Land, buildings and equipment, net 2,221 1,983 1,757 1,774 1,780
Long-term debt, including current portion 2,238 2,497 631 934 1,030
Shareholders’ equity 1,210 1,115 2,169 2,093 1,789
Book value per share 5.62 5.05 8.43 7.76 6.59
Total assets 5,661 5,600 4,822 4,921 4,605
Store Information (at year end)
Full-line stores 109 101 98 98 94
Rack and other stores 60 55 57 57 56
International Façonnable boutiques - - 36 32 31
Total square footage 21,876,000 20,502,000 20,170,000 20,070,000 19,397,000
1Same-stores include stores that have been open at least one full year at the beginning of the year and merchandise sales from our Direct segment. Fiscal year 2006 includes an extra week
(the 53rd week) as a result of our 4-5-4 retail reporting calendar. The 53rd week is not included in same-store sales calculations.
2As described in Note 1 of the Notes to Consolidated Financial Statements in Item 8, we have reclassified credit card revenues and selling, general and administrative expenses for our credit
segment in our consolidated statements of earnings to more clearly present our credit card business. Credit card revenues include finance charges, late and other fees generated by our
combined Nordstrom private label card and Nordstrom VISA credit card programs, and interchange fees generated by the use of Nordstrom VISA cards at third-party merchants. These
revenues were previously included in finance charges and other, net in our consolidated statement of earnings. Selling, general and administrative expenses for our credit segment consist
of operational and marketing costs incurred to support and service our credit card programs and bad debt expense, and were previously included in total selling, general and
administrative expenses in our consolidated statements of earnings.
3Gross profit is calculated as net sales less cost of sales and related buying and occupancy costs (for all segments).
4Gross profit and selling, general and administrative rates are calculated as a percentage of net sales.
5Sales per square foot is calculated as net sales for all of our segments divided by weighted average square footage.
6During the third quarter of 2007, we completed the sale of our Façonnable business and realized a gain on sale of $34 ($21, net of tax). Results of operations for fiscal year 2007 include the
international Façonnable boutiques through August 31, 2007 and the domestic Façonnable boutiques through October 31, 2007. Prior to the sale, the domestic Façonnable boutiques were
included in “Rack and other stores.”