Nordstrom 2008 Annual Report Download - page 20
Download and view the complete annual report
Please find page 20 of the 2008 Nordstrom annual report below. You can navigate through the pages in the report by either clicking on the pages listed below, or by using the keyword search tool below to find specific information within the annual report.
20
INTEREST EXPENSE
Interest is assigned to the Credit segment proportionate to the amount of debt estimated to fund our credit card receivables, which assumes a mix of
80% debt and 20% equity. The average accounts receivable investment metric included in the table on the previous page represents our best estimate
of the amount of capital for our credit card program that is financed by equity. As a means of assigning comparable cost of capital for our credit card
business, we believe it is important to maintain a capital structure similar to other financial institutions. Based on our research, we have found that
debt as a percentage of credit card receivables for other credit card companies ranges from 70% to 90%. We believe that debt equal to 80% of our
credit card receivables is appropriate given our overall capital structure goals.
Interest expense decreased to $50 in 2008 from $64 in 2007 due to declining variable interest rates, partially offset by higher average borrowings.
Interest expense increased in 2007 compared to 2006 due to higher variable interest rates and higher average borrowings due to bringing the
Nordstrom VISA portfolio on-balance sheet as well as year over year portfolio growth.
COST OF SALES
Cost of sales includes the estimated cost of Nordstrom Notes that will be issued and redeemed under the rewards program. The increase in cost of
sales expense in 2007 compared with 2006 was due to growth in volume.
CREDIT SELLING, GENERAL AND ADMINISTRATIVE EXPENSES
Selling, general and administrative expenses for our credit segment are made up of bad debt and operational and marketing expenses, which are
summarized in the following table:
Fiscal year 2008 2007 2006
Bad debt expense1 $173 $107 $17
Operational and marketing expense 102 91 75
Total credit selling, general and administrative expense $275 $198 $92
1In 2007, the one-time transitional charge-offs on the Nordstrom VISA receivables of $21 are included in other income and expense, net on our consolidated statement of earnings. In
the above disclosure this amount is included in bad debt expense. These charge-offs represent actual write-offs on the Nordstrom VISA credit card portfolio during the eight-month
transitional period.
Bad Debt Expense
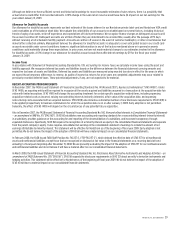
Bad debt expense increased to $173 in 2008 from $107 in 2007 due to increased delinquencies and write-offs reflecting current consumer credit trends,
as well as reserves for higher projected losses inherent in the receivables portfolio as of January 31, 2009. Overall, we believe our credit card portfolio
remains high quality compared with the credit card industry as a whole, with customers considered to have prime or better credit scores making up
approximately 90% of total spending on our credit cards in 2008. While our delinquency and write-off rates have been negatively impacted by the
current economic conditions, our rates remain relatively low when compared to the credit card industry average.
The following table illustrates the allowance for doubtful accounts activity for the past three fiscal years:
Fiscal year 2008 2007 2006
Allowance at beginning of period $73 $17 $18
Bad debt provision1 173 86 17
Net write–offs (on–balance sheet) (108) (30) (18)
Allowance at end of period $138 $73 $17
Allowance as a percentage of on-balance sheet
accounts receivable 6.8% 4.1% 2.7%
Bad debt provision as a percentage of average on-balance sheet
accounts receivable 9.1% 5.8% 2.8%
Net write-offs as a percentage of average receivables2 5.6% 3.5% 2.5%
1 In 2007, the one-time transitional charge-offs on the Nordstrom VISA receivables of $21 are included in bad debt expense in the selling, general and administrative expenses table above.
These charge-offs represent actual write-offs on the Nordstrom VISA credit card portfolio during the eight-month transitional period and are not included in the allowance for doubtful
accounts activity in the table above for 2007.
2 Calculated as net write-offs for the combined Nordstrom private label and Nordstrom VISA portfolio as a percentage of average receivables, including average off-balance sheet receivables
in 2007 and 2006 of $182 and $816, respectively.
Operational and Marketing Expense
Operational and marketing expenses are incurred to support and service our credit card products and are included in selling, general and
administrative expenses in the consolidated statement of earnings. Operational and marketing expense increased from $91 in 2007 to $102 in 2008
primarily due to additional marketing expenses as a result of an increase in promotions related to our loyalty program in 2008. The increase in 2007
compared with 2006 was due to the launch of the Fashion Rewards program in 2007.


