Nordstrom 2008 Annual Report Download - page 24
Download and view the complete annual report
Please find page 24 of the 2008 Nordstrom annual report below. You can navigate through the pages in the report by either clicking on the pages listed below, or by using the keyword search tool below to find specific information within the annual report.-
 1
1 -
2
-
3
-
4
-
5
-
6
-
7
-
8
-
9
-
10
-
11
-
12
-
13
-
 14
14 -
 15
15 -
 16
16 -
 17
17 -
 18
18 -
 19
19 -
 20
20 -
 21
21 -
 22
22 -
 23
23 -
 24
24 -
 25
25 -
 26
26 -
 27
27 -
 28
28 -
 29
29 -
 30
30 -
 31
31 -
 32
32 -
 33
33 -
 34
34 -
35
-
36
-
37
-
38
-
39
-
40
-
41
-
42
-
43
-
44
-
45
-
46
-
47
-
48
-
49
-
50
-
51
-
52
-
53
-
54
-
55
-
56
-
57
-
58
-
59
-
60
-
61
-
62
-
63
-
64
-
65
-
66
 |
 |

24
LIQUIDITY AND CAPITAL RESOURCES
The following discussion of Liquidity and Capital Resources reflects the effects of the correction discussed in Note 1 of the Notes to Consolidated
Financial Statements in Item 8 of this Annual Report on Form 10-K.
We maintain a level of liquidity sufficient to allow us to cover our seasonal cash needs and to minimize our need for short-term borrowings. We believe
that our operating cash flows and available credit facilities are sufficient to finance our cash requirements for the next 12 months.
Over the long term, we manage our cash and capital structure to maximize shareholder return, strengthen our financial position and maintain
flexibility for future strategic initiatives. We continuously assess our debt and leverage levels, capital expenditure requirements, principal debt
payments, dividend payouts, potential share repurchases and future investments or acquisitions. We believe our operating cash flows and available
credit facilities, as well as any potential future borrowing facilities, will be sufficient to fund these scheduled future payments and potential
long-term initiatives.
In 2008 cash decreased by $286 to $72 as of January 31, 2009. The decrease was driven by capital expenditures of $563, returns to our shareholders
through dividends and repurchases of our common stock totaling $402, and purchases made by our customers for third-party merchandise and services
using Nordstrom VISA credit cards of $232. These decreases were partially offset by cash provided by operating activities of $848.
Operating Activities
The majority of our operating cash inflows are related to sales to our customers, including the collection of accounts receivable. We also receive cash
payments for property incentives from developers. Our operating cash outflows generally consist of payments to our inventory vendors (net of vendor
allowances), payments to our employees for wages, salaries and other employee benefits, and payments to our landlords for rent. Operating cash
outflows also include payments for income taxes and interest payments on our short and long-term borrowings.
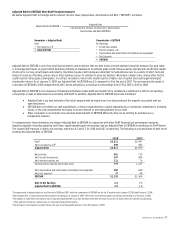
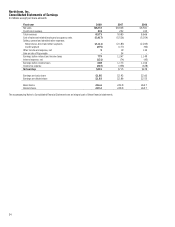
2008 VS 2007 OPERATING ACTIVITIES
Net cash provided by operating activities increased from $312 in 2007 to $848 in 2008. In 2007, the conversion of our Nordstrom VISA credit card
receivables into an on-balance sheet securitization program reduced cash provided by operating activities by $663. As a result of this transaction, we
recorded the Nordstrom VISA credit card receivables on our consolidated balance sheet and eliminated our investment in asset backed securities. The
increase in cash provided by operating activities in 2008 compared with 2007 was also due to lower variable expenses, fixed cost reductions and a decrease
in cash paid for taxes in 2008. These increases were offset by the impact of declining sales in 2008 as well as an increase in cash paid for interest.
2009 FORECAST OF OPERATING ACTIVITIES
In 2009, we expect our operating cash flows to decline as a result of lower sales.
Investing Activities
Our investing cash flows typically consist of capital expenditures and, beginning in the second quarter of 2007, customer purchases (net of payments) for
goods and services outside of Nordstrom using the Nordstrom VISA credit cards.
2008 VS 2007 INVESTING ACTIVITIES
Net cash used in investing activities increased $371 to $792 in 2008, primarily due to an increase in third-party purchases using the Nordstrom VISA credit
cards and an increase in capital expenditures. Additionally, the sale of our Façonnable business in 2007 partially offset investing cash outflows in the
prior year.
In 2008, we experienced growth in our Nordstrom VISA credit receivables related to purchases made by our customers for merchandise and services
outside of Nordstrom. This drove an increase in cash used for accounts receivable originated at third parties, which was $232 in 2008 compared with
$151 in 2007. The Nordstrom VISA credit cards enable our customers to purchase at merchants outside of Nordstrom and accumulate points for our
Nordstrom Fashion Rewards® program (two points per dollar spent at Nordstrom and one point per dollar spent outside of Nordstrom stores). Upon
reaching two thousand points, customers receive twenty dollars in Nordstrom Notes®, which can be redeemed for goods or services in our stores.
We believe participation in the Fashion Rewards program has resulted in beneficial shifts in customer spending patterns and incremental sales in
our stores.
CAPITAL EXPENDITURES
Our capital expenditures over the last three years totaled $1,328, with $563 in 2008, $501 in 2007 and $264 in 2006. With these capital expenditures, we
added stores, enhanced existing facilities and improved our information systems. The largest components of these expenditures were for new or
relocated stores and store remodels. We also received property incentives from our developers of $119 in 2008, $58 in 2007 and $31 in 2006. These
incentives are included in our cash provided by operations in our consolidated statements of cash flows, however operationally we view these as an
offset to our capital expenditures. Our capital expenditures, net of property incentives, for the last three years by category are summarized in the
following table:
Fiscal year 2008 2007 2006
Category:
New store openings and relocations 55% 51% 35%
Remodels (major and minor) 30% 27% 39%
Information technology 8% 8% 13%
Other 7% 14% 13%
Total 100% 100% 100%