Nordstrom 2008 Annual Report Download - page 17
Download and view the complete annual report
Please find page 17 of the 2008 Nordstrom annual report below. You can navigate through the pages in the report by either clicking on the pages listed below, or by using the keyword search tool below to find specific information within the annual report.-
 1
1 -
2
-
3
-
4
-
5
-
6
-
 7
7 -
 8
8 -
 9
9 -
 10
10 -
 11
11 -
 12
12 -
 13
13 -
 14
14 -
 15
15 -
 16
16 -
 17
17 -
 18
18 -
 19
19 -
 20
20 -
 21
21 -
 22
22 -
 23
23 -
 24
24 -
 25
25 -
 26
26 -
 27
27 -
28
-
29
-
30
-
31
-
32
-
33
-
34
-
35
-
36
-
37
-
38
-
39
-
40
-
41
-
42
-
43
-
44
-
45
-
46
-
47
-
48
-
49
-
50
-
51
-
52
-
53
-
54
-
55
-
56
-
57
-
58
-
59
-
60
-
61
-
62
-
63
-
64
-
65
-
66
 |
 |

Nordstrom, Inc. and subsidiaries 17
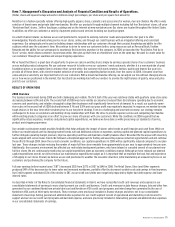
Our full-line stores had a 2.5% same-store sales increase in 2007, on top of a 5.9% increase in 2006. The Midwest, South and Northwest were our
strongest performing regions during 2007. By category, our largest same-store sales increases came from our designer apparel, women’s accessories
and men’s apparel categories. Designer apparel offers fashion-forward and aspirational products, and customer demand for these products was strong.
Women’s accessories benefited from increased sales of handbags and fashion jewelry. The increase in men’s apparel was in part due to growth in our
younger contemporary offering.
Our Rack same-store sales increased 8.7% in 2007, following a 10.9% increase in 2006. The sales growth came from all regions and merchandise
categories. Same-store sales were consistent across all regions, which showed high single-digit increases. The largest same-store sales increases were
in accessories and men’s apparel. High performance bodywear, watches and sunglasses led the accessories category. The men’s increase reflects sales
from premium denim, suits and dress shirts.
Nordstrom Direct’s 2007 total net sales increased 17.9% to $644. The growth in our Direct business was driven by our efforts to better align our online
shopping environment with the customer experience in our full-line stores. This includes aligning our merchandise offering with the full-line stores to
create a seamless experience for customers.
During 2007 we opened three new full-line stores and one new Rack store. These new stores represent 1.0% of our total net sales for fiscal 2007, and
increased our gross square footage by 2.6% during 2007.
2009 FORECAST OF SAME-STORE SALES
As of March 20, 2009, we have relocated one full-line store and opened two new Rack stores. In total, we plan to open three new full-line stores and eight
additional Rack stores during the year. This will increase retail square footage by approximately 3.7%. We expect 2009 same-store sales to decrease
approximately 10% to 15%. Based on the pace of business in 2008, same-store sales in the first half of 2009 are expected to be 300 to 400 basis points
lower than the projected annual rate.
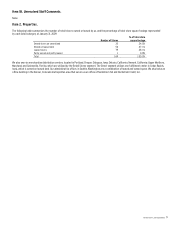
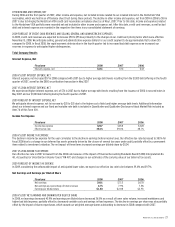
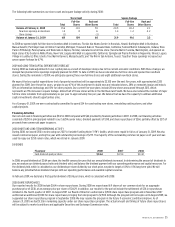
Gross Profit
Fiscal year 2008 2007 2006
Gross profit1 $2,905 $3,349 $3,245
Gross profit rate2 35.1% 37.9% 37.9%
Average inventory per square foot $49.00 $52.70 $52.37
Inventory turnover rate3 5.20 5.16 5.06
1Gross profit is calculated as net sales less Retail Stores, Direct and Other segment cost of sales and related buying and occupancy costs.
2Gross profit rate is calculated as gross profit divided by net sales.
3Inventory turnover rate is calculated as annual cost of sales and related buying and occupancy costs (for all segments) divided by 5-quarter average inventory.
2008 VS 2007 GROSS PROFIT
Gross profit dollars decreased $444 from last year while our gross profit rate declined 280 basis points. Our gross profit rate is made up of both
merchandise margin rates and buying and occupancy cost rate. The deterioration for the year was driven primarily by a decrease in our merchandise
margin rate as we utilized markdowns to respond to slower sales and a more competitive environment. All major merchandise categories at our full-
line stores contributed to this decrease. Our buying and occupancy costs as a percentage of sales increased 76 basis points as many of these costs are
fixed relative to the sales decline.
Our average inventory turnover improved slightly over last year while our average inventory per square foot decreased 7.0% compared to the prior
year. Our merchants’ efforts to align inventory levels to lower demand resulted in the improvement in our inventory turnover rate and our lower
inventory per square foot. Our objective is to match the change in inventory per square foot, which declined 7.0% on average, with our same-store
sales rate, which declined 9.0% for the year.
2007 VS 2006 GROSS PROFIT
Our gross profit rate in 2007 was consistent with 2006. During 2007 we experienced increasing inventory levels coupled with slower sales trends.
To realign our inventory levels, we took higher markdowns during the last half of the year. The increase in markdowns was offset by a decrease in our
buying and occupancy costs, which declined due to lower performance-based incentives and from the sale of our Façonnable business in 2007.
The increase in our average inventory per square foot in 2007 compared with 2006 supported the growth of our designer business in apparel,
accessories and shoes. Although we encountered softer sales trends during the latter half of 2007, inventory discipline and growth in sales throughout
the year resulted in improvement in our inventory turnover rate, which increased 1.9%.
2009 FORECAST OF GROSS PROFIT
In 2009, we expect a 150 to 250 basis point decrease in our gross profit rate. Although we begin 2009 with a good inventory position, we expect continued
gross margin pressure as a result of competitive pressure and lower levels of customer demand. We will also incur additional occupancy expense for the
three new full-line stores and ten new Rack stores in 2009.