Nordstrom 2008 Annual Report Download - page 53
Download and view the complete annual report
Please find page 53 of the 2008 Nordstrom annual report below. You can navigate through the pages in the report by either clicking on the pages listed below, or by using the keyword search tool below to find specific information within the annual report.-
 1
1 -
2
-
3
-
4
-
5
-
6
-
7
-
8
-
9
-
10
-
11
-
12
-
13
-
14
-
15
-
16
-
17
-
18
-
19
-
20
-
21
-
22
-
23
-
24
-
25
-
26
-
27
-
28
-
29
-
30
-
31
-
32
-
33
-
34
-
35
-
36
-
37
-
38
-
39
-
40
-
41
-
42
-
 43
43 -
 44
44 -
 45
45 -
 46
46 -
 47
47 -
 48
48 -
 49
49 -
 50
50 -
 51
51 -
 52
52 -
 53
53 -
 54
54 -
 55
55 -
 56
56 -
 57
57 -
 58
58 -
 59
59 -
 60
60 -
 61
61 -
 62
62 -
 63
63 -
64
-
65
-
66
 |
 |

Nordstrom, Inc. and subsidiaries 53
Nordstrom, Inc.
Notes to Consolidated Financial Statements
Dollar and share amounts in millions except per share and per option amounts
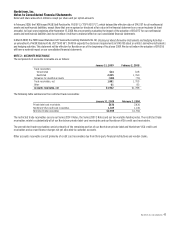
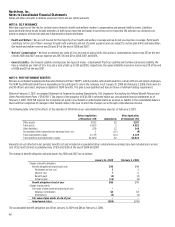
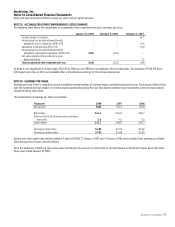
NOTE 13: ACCUMULATED OTHER COMPREHENSIVE (LOSS) EARNINGS
The following table shows the components of accumulated other comprehensive (loss) earnings, net of tax:
January 31, 2009 February 2, 2008 February 3, 2007
Foreign currency translation — - $15
Unrecognized loss on postretirement benefit
obligations, prior to adoption of SFAS 158
—
-
(16)
Adjustment to initially apply SFAS 158 — - (13)
Unrecognized loss on postretirement benefit
obligations, subsequent to adoption of SFAS 158
$(10)
$(22)
—
Fair value adjustment to investment in asset
backed securities — - 5
Total accumulated other comprehensive loss $(10) $(22) $(9)
Included in our adjustment to initially apply SFAS 158 in 2006 are our SERP and our employee retiree medical plan. The adoption of SFAS 158 had a
$(3) impact (net of tax of $2) to accumulated other comprehensive earnings for the retiree medical plan.
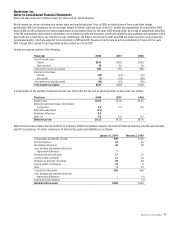
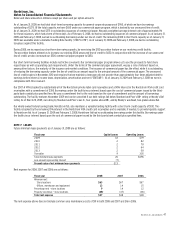
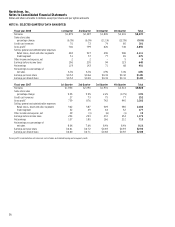
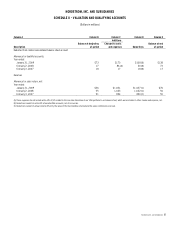
NOTE 14: EARNINGS PER SHARE
Earnings per basic share is computed using the weighted average number of common shares outstanding during the year. Earnings per diluted share
uses the weighted average number of common shares outstanding during the year plus dilutive common stock equivalents, primarily stock options
and performance share units.
The computation of earnings per share is as follows:
Fiscal year 2008 2007 2006
Net earnings $401 $715 $678
Basic shares 216.6 244.8
260.7
Dilutive effect of stock options and performance
share units 2.6 4.0 5.0
Diluted shares 219.2 248.8 265.7
Earnings per basic share $1.85 $2.92 $2.60
Earnings per diluted share $1.83 $2.88 $2.55
Options and other equity instruments totaling 4.9 shares in 2008, 2.7 shares in 2007 and 1.9 shares in 2006 were excluded from earnings per diluted
share because their impact was anti-dilutive.
Since the beginning of 2006, 6.9 shares have been issued upon the exercise of stock options; we repurchased a total of 62.5 shares during the three
fiscal years ended January 31, 2009.