Nordstrom 2008 Annual Report Download - page 13
Download and view the complete annual report
Please find page 13 of the 2008 Nordstrom annual report below. You can navigate through the pages in the report by either clicking on the pages listed below, or by using the keyword search tool below to find specific information within the annual report.-
 1
1 -
2
-
 3
3 -
 4
4 -
 5
5 -
 6
6 -
 7
7 -
 8
8 -
 9
9 -
 10
10 -
 11
11 -
 12
12 -
 13
13 -
 14
14 -
 15
15 -
 16
16 -
 17
17 -
 18
18 -
 19
19 -
 20
20 -
 21
21 -
 22
22 -
 23
23 -
24
-
25
-
26
-
27
-
28
-
29
-
30
-
31
-
32
-
33
-
34
-
35
-
36
-
37
-
38
-
39
-
40
-
41
-
42
-
43
-
44
-
45
-
46
-
47
-
48
-
49
-
50
-
51
-
52
-
53
-
54
-
55
-
56
-
57
-
58
-
59
-
60
-
61
-
62
-
63
-
64
-
65
-
66
 |
 |

Nordstrom, Inc. and subsidiaries 13
PART II
Item 5. Market for Registrant’s Common Equity, Related Shareholder Matters and Issuer Purchases of
Equity Securities.
MARKET, SHAREHOLDER AND DIVIDEND INFORMATION
Our common stock, without par value, is traded on the New York Stock Exchange under the symbol “JWN.” The approximate number of holders
of common stock as of March 11, 2009 was 103,543, based upon the number of registered and beneficial shareholders, as well as the number of
employee shareholders in the Nordstrom 401(k) Plan and Profit Sharing Plan. On this date we had 215,485,680 shares of common stock outstanding.
The high and low sales prices of our common stock and dividends declared for each quarter of 2008 and 2007 are presented in the table below:
Common Stock Price
2008 2007 Dividends per Share
High Low High Low 2008 2007
1st Quarter $40.59 $30.72 $59.70 $49.35 $0.16 $0.135
2nd Quarter $38.65 $25.67 $56.00 $42.70 $0.16 $0.135
3rd Quarter $37.00 $13.66 $53.47 $36.12 $0.16 $0.135
4th Quarter $18.17 $6.61 $39.95 $28.00 $0.16 $0.135
Full Year $40.59 $6.61 $59.70 $28.00 $0.64 $0.54
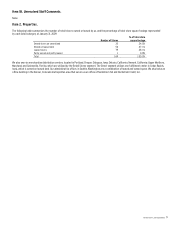
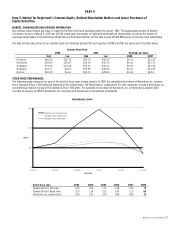
STOCK PRICE PERFORMANCE
The following graph compares, for each of the last five fiscal years ending January 31, 2009, the cumulative total return of Nordstrom, Inc. common
stock, Standard & Poor’s 500 Index and Standard & Poor’s Retail Index. The Retail Index is comprised of 27 retail companies, including Nordstrom, Inc.,
representing an industry group of the Standard & Poor’s 500 Index. The cumulative total return of Nordstrom, Inc. common stock assumes $100
invested on January 31, 2004 in Nordstrom, Inc. common stock and assumes reinvestment of dividends.
End of fiscal year: 2003 2004 2005 2006 2007 2008
Standard & Poor’s 500 Index 100 104 113 128 123 73
Standard & Poor’s Retail Index 100 114 123 140 113 69
Nordstrom, Inc. common stock 100 122 219 296 209 72
PERFORMANCE GRAPH
0
100
200
300
1/31/04 1/29/05 1/28/06 2/3/07 2/2/08 1/31/09
Year Ended
Dollars
Nordstrom, Inc. Common Stock
Standard & Poor's Retail Index
Standard & Poor's 500 Index