Nordstrom 2008 Annual Report Download - page 49
Download and view the complete annual report
Please find page 49 of the 2008 Nordstrom annual report below. You can navigate through the pages in the report by either clicking on the pages listed below, or by using the keyword search tool below to find specific information within the annual report.-
 1
1 -
2
-
3
-
4
-
5
-
6
-
7
-
8
-
9
-
10
-
11
-
12
-
13
-
14
-
15
-
16
-
17
-
18
-
19
-
20
-
21
-
22
-
23
-
24
-
25
-
26
-
27
-
28
-
29
-
30
-
31
-
32
-
33
-
34
-
35
-
36
-
37
-
38
-
 39
39 -
 40
40 -
 41
41 -
 42
42 -
 43
43 -
 44
44 -
 45
45 -
 46
46 -
 47
47 -
 48
48 -
 49
49 -
 50
50 -
 51
51 -
 52
52 -
 53
53 -
 54
54 -
 55
55 -
 56
56 -
 57
57 -
 58
58 -
 59
59 -
60
-
61
-
62
-
63
-
64
-
65
-
66
 |
 |

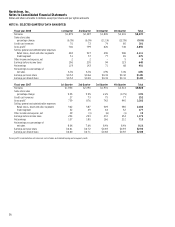
Nordstrom, Inc. and subsidiaries 49
Nordstrom, Inc.
Notes to Consolidated Financial Statements
Dollar and share amounts in millions except per share and per option amounts
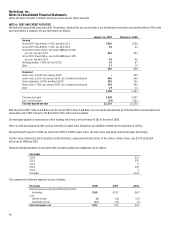
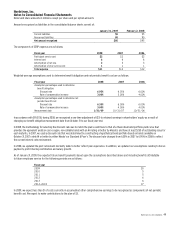
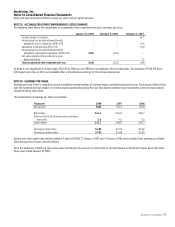
Amounts recognized as liabilities in the consolidated balance sheets consist of:
January 31, 2009 February 2, 2008
Current liabilities $5 $5
Noncurrent liabilities 80 90
Net amount recognized $85 $95
The components of SERP expense are as follows:
Fiscal year 2008 2007 2006
Participant service cost $2 $2 $2
Interest cost 6 6 6
Amortization of net loss 2 3 3
Amortization of prior service cost 1 1 1
Total expense $11 $12 $12
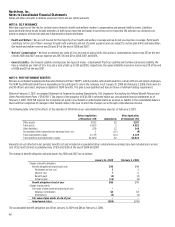
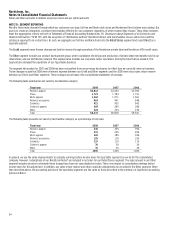
Weighted-average assumptions used to determine benefit obligation and net periodic benefit cost are as follows:
Fiscal year 2008 2007 2006
Assumption percentages used to determine
benefit obligation:
Discount rate 6.95% 6.35% 6.00%
Rate of compensation increase 3.00% 3.00% 4.00%
Assumption percentages used to determine net
periodic benefit cost:
Discount rate 6.35% 6.00% 6.00%
Rate of compensation increase 3.00% 4.00% 4.00%
Measurement date 1/31/09 10/31/07 10/31/06
In accordance with SFAS 158, during 2008, we recognized a one-time adjustment of ($3) to retained earnings in shareholders’ equity as a result of
changing our benefit obligation measurement date from October 31 to our fiscal year-end.
In 2008, the methodology for selecting the discount rate was to match the plan’s cash flows to that of a theoretical bond portfolio yield curve that
provides the equivalent yields on zero-coupon, non-callable bonds with an AA rating or better by Moody’s and have at least $250 of outstanding issue for
each maturity. In 2007, we used a discount rate that was determined by constructing a hypothetical bond portfolio based on bonds available on
October 31, 2007 rated AA or better by either Moody’s or Standard & Poor’s. The discount rate changed from 6.35% in 2007 to 6.95% in 2008 to reflect
the current interest rate environment.
In 2008, we updated the post-retirement mortality table to better reflect plan experience. In addition, we updated our assumptions relating to bonus
payments, profit sharing contribution and salary growth.
As of January 31, 2009, the expected future benefit payments based upon the assumptions described above and including benefits attributable
to future employee service for the following periods are as follows:
Fiscal year
2009 $5
2010 5
2011 5
2012 6
2013 6
2014-2018 37
In 2009, we expect less than $1 of costs currently in accumulated other comprehensive earnings to be recognized as components of net periodic
benefit cost. We expect to make contributions to the plan of $5.