NetZero 2011 Annual Report Download - page 82
Download and view the complete annual report
Please find page 82 of the 2011 NetZero annual report below. You can navigate through the pages in the report by either clicking on the pages listed below, or by using the keyword search tool below to find specific information within the annual report.-
 1
1 -
2
-
3
-
4
-
5
-
6
-
7
-
8
-
9
-
10
-
11
-
12
-
13
-
14
-
15
-
16
-
17
-
18
-
19
-
20
-
21
-
22
-
23
-
24
-
25
-
26
-
27
-
28
-
29
-
30
-
31
-
32
-
33
-
34
-
35
-
36
-
37
-
38
-
39
-
40
-
41
-
42
-
43
-
44
-
45
-
46
-
47
-
48
-
49
-
50
-
51
-
52
-
53
-
54
-
55
-
56
-
57
-
58
-
59
-
60
-
61
-
62
-
63
-
64
-
65
-
66
-
67
-
68
-
69
-
70
-
71
-
 72
72 -
 73
73 -
 74
74 -
 75
75 -
 76
76 -
 77
77 -
 78
78 -
 79
79 -
 80
80 -
 81
81 -
 82
82 -
 83
83 -
 84
84 -
 85
85 -
 86
86 -
 87
87 -
 88
88 -
 89
89 -
 90
90 -
 91
91 -
 92
92 -
93
-
94
-
95
-
96
-
97
-
98
-
99
-
100
-
101
-
102
-
103
-
104
-
105
-
106
-
107
-
108
-
109
-
110
-
111
-
112
-
113
-
114
-
115
-
116
-
117
-
118
-
119
-
120
-
121
-
122
-
123
-
124
-
125
-
126
-
127
-
128
-
129
-
130
-
131
-
132
-
133
-
134
-
135
-
136
-
137
-
138
-
139
-
140
-
141
-
142
-
143
-
144
-
145
-
146
-
147
-
148
-
149
-
150
-
151
-
152
-
153
-
154
-
155
-
156
-
157
-
158
-
159
-
160
-
161
-
162
-
163
-
164
-
165
-
166
-
167
-
168
-
169
-
170
-
171
-
172
 |
 |

Table of Contents
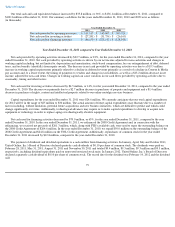
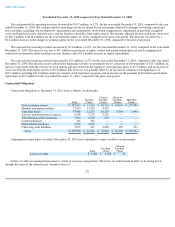
Our total cash and cash equivalents balance increased by $35.8 million, or 36%, to $136.1 million at December 31, 2011, compared to
$100.3 million at December 31, 2010. Our summary cash flows for the years ended December 31, 2011, 2010 and 2009 were as follows
(in thousands):
Year Ended December 31, 2011 compared to Year Ended December 31, 2010
Net cash provided by operating activities decreased by $32.7 million, or 23%, for the year ended December 31, 2011, compared to the year
ended December 31, 2010. Net cash provided by operating activities is driven by our net income adjusted for non-cash items and changes in
working capital including, but not limited to, depreciation and amortization, stock-based compensation, loss on extinguishment of debt, deferred
taxes, and tax benefits (shortfalls) from equity awards. The decrease in net cash provided by operating activities was due to a $19.5 million
increase in working capital requirements primarily related to a decline in deferred revenue primarily as a result of a decline in Content & Media
pay accounts and, to a lesser extent, the timing of payments to vendors and changes in tax liabilities, as well as a $13.2 million decrease in net
income, adjusted for non-cash items. Changes in working capital can cause variation in our cash flows provided by operating activities due to
seasonality, timing and other factors.
Net cash used for investing activities decreased by $4.5 million, or 14%, for the year ended December 31, 2011, compared to the year ended
December 31, 2010. The decrease was primarily due to a $2.7 million decrease in purchases of property and equipment and a $1.4 million
decrease in purchases of rights, content and intellectual property related to our online nostalgia services business.
Capital expenditures for the year ended December 31, 2011 were $24.6 million. We currently anticipate that our total capital expenditures
for 2012 will be in the range of $25 million to $30 million. The actual amount of future capital expenditures may fluctuate due to a number of
factors including, without limitation, potential future acquisitions and new business initiatives, which are difficult to predict and which could
change significantly over time. Additionally, technological advances may require us to make capital expenditures to develop or acquire new
equipment or technology in order to replace aging or technologically obsolete equipment.
Net cash used for financing activities decreased by $79.0 million, or 63%, for the year ended December 31, 2011, compared to the year
ended December 31, 2010. In the year ended December 31, 2011, we refinanced the 2008 Credit Agreement and, in connection with the
refinancing, we received net proceeds of $261.3 million, which, along with FTD's available cash, were used to repay the outstanding balance on
the 2008 Credit Agreement of $264.6 million. In the year ended December 31, 2010, we repaid $50.0 million on the outstanding balance of the
2008 Credit Agreement and $24.8 million on the UOL Credit Agreement. Additionally, repurchases of common stock for the year ended
December 31, 2011 decreased by $12.8 million, compared to the year ended December 31, 2010.
The payment of dividends and dividend equivalents is a cash outflow from financing activities. In January, April, July and October 2011,
United Online, Inc.'s Board of Directors declared quarterly cash dividends of $0.10 per share of common stock. The dividends were paid on
February 28, 2011, May 31, 2011, August 31, 2011 and November 30, 2011 and totaled $9.4 million, $9.3 million, $9.3 million and $9.3 million,
respectively, including dividend equivalents paid on nonvested restricted stock units. In January 2012, United Online, Inc.'s Board of Directors
declared a quarterly cash dividend of $0.10 per share of common stock. The record date for the dividend was February 14, 2012 and the dividend
will
79
Year Ended December 31,
2011 2010 2009
Net cash provided by operating activities
$
111,117
$
143,803
$
163,526
Net cash used for investing activities
$
(27,241
)
$
(31,756
)
$
(26,160
)
Net cash used for financing activities
$
(46,150
)
$
(125,113
)
$
(128,019
)