NetZero 2011 Annual Report Download - page 67
Download and view the complete annual report
Please find page 67 of the 2011 NetZero annual report below. You can navigate through the pages in the report by either clicking on the pages listed below, or by using the keyword search tool below to find specific information within the annual report.-
 1
1 -
2
-
3
-
4
-
5
-
6
-
7
-
8
-
9
-
10
-
11
-
12
-
13
-
14
-
15
-
16
-
17
-
18
-
19
-
20
-
21
-
22
-
23
-
24
-
25
-
26
-
27
-
28
-
29
-
30
-
31
-
32
-
33
-
34
-
35
-
36
-
37
-
38
-
39
-
40
-
41
-
42
-
43
-
44
-
45
-
46
-
47
-
48
-
49
-
50
-
51
-
52
-
53
-
54
-
55
-
56
-
 57
57 -
 58
58 -
 59
59 -
 60
60 -
 61
61 -
 62
62 -
 63
63 -
 64
64 -
 65
65 -
 66
66 -
 67
67 -
 68
68 -
 69
69 -
 70
70 -
 71
71 -
 72
72 -
 73
73 -
 74
74 -
 75
75 -
 76
76 -
 77
77 -
78
-
79
-
80
-
81
-
82
-
83
-
84
-
85
-
86
-
87
-
88
-
89
-
90
-
91
-
92
-
93
-
94
-
95
-
96
-
97
-
98
-
99
-
100
-
101
-
102
-
103
-
104
-
105
-
106
-
107
-
108
-
109
-
110
-
111
-
112
-
113
-
114
-
115
-
116
-
117
-
118
-
119
-
120
-
121
-
122
-
123
-
124
-
125
-
126
-
127
-
128
-
129
-
130
-
131
-
132
-
133
-
134
-
135
-
136
-
137
-
138
-
139
-
140
-
141
-
142
-
143
-
144
-
145
-
146
-
147
-
148
-
149
-
150
-
151
-
152
-
153
-
154
-
155
-
156
-
157
-
158
-
159
-
160
-
161
-
162
-
163
-
164
-
165
-
166
-
167
-
168
-
169
-
170
-
171
-
172
 |
 |

Table of Contents
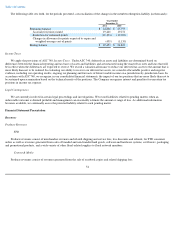
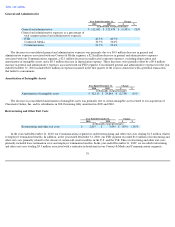
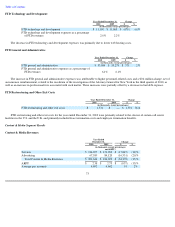
FTD Restructuring and Other Exit Costs
FTD restructuring and other exit costs for the year ended December 31, 2011 totaled $0.9 million and were associated with reductions in
headcount. Restructuring and other exit costs for the year ended December 31, 2010 totaled $1.6 million and primarily related to the closure of
certain call center facilities in the U.S. and the U.K.
Content & Media Segment Results
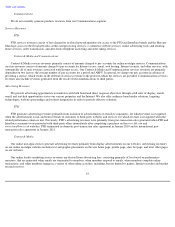
Content & Media Revenues
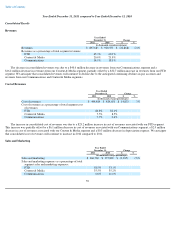
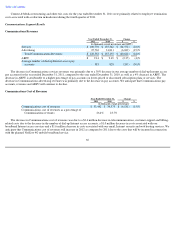
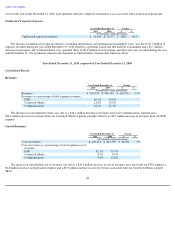
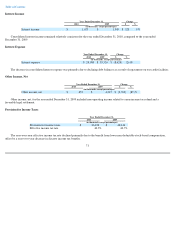
The decrease in Content & Media services revenues was a result of a 15% decrease in our average number of pay accounts for the year
ended December 31, 2011 compared to the year ended December 31, 2010, partially offset by a 9% increase in ARPU. The increase in ARPU
was primarily attributable to an overall decrease in the percentage of pay accounts on discounted plans and a higher percentage of domestic pay
accounts on shorter-term subscription plans, which have higher ARPUs. In addition, Content & Media advertising revenues decreased due to a
decrease in segment active accounts and a decrease in available inventory on the Classmates website as well as a decrease in advertising
revenues generated by our online loyalty marketing service due to a number of factors, including the loss of a major customer. These decreases
were partially offset by $0.9 million in products revenues generated in the year ended December 31, 2011. We anticipate that Content & Media
pay accounts and revenues will continue to decline.
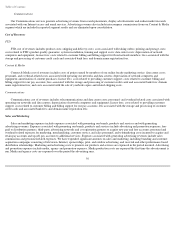
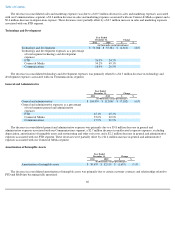
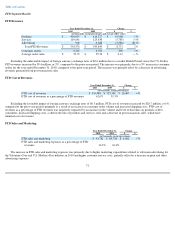
Content & Media Cost of Revenues
The decrease in Content & Media cost of revenues was primarily due to a $1.6 million decrease in personnel- and overhead-
related costs, an
$0.8 million decrease in bank fees and a $0.5 million decrease in the cost of points earned by members of our online loyalty marketing service.
64
Year Ended
December 31, Change
2011 2010 $ %
(in thousands, except percentages)
FTD restructuring and other exit costs
$
876
$
1,574
$
(698
)
(44
)%
Year Ended December 31, Change
2011
2010
$
%
(in thousands, except percentages and ARPU)
Products
$
864
$
—
$
864
N/A
Services
123,992
134,055
(10,063
)
(8
)%
Advertising
60,619
67,589
(6,970
)
(10
)%
Total Content & Media Revenues
$
185,475
$
201,644
$
(16,169
)
(8
)%
ARPU
$
2.59
$
2.38
$
0.21
9
%
Average pay accounts
3,992
4,693
(701
)
(15
)%
Year Ended December 31,
Change
2011
2010
$
%
(in thousands, except percentages)
Content & Media cost of revenues
$
32,575
$
35,514
$
(2,939
)
(8
)%
Content & Media cost of revenues as a percentage of
Content & Media revenues
17.6
%
17.6
%