NetZero 2011 Annual Report Download - page 141
Download and view the complete annual report
Please find page 141 of the 2011 NetZero annual report below. You can navigate through the pages in the report by either clicking on the pages listed below, or by using the keyword search tool below to find specific information within the annual report.-
 1
1 -
2
-
3
-
4
-
5
-
6
-
7
-
8
-
9
-
10
-
11
-
12
-
13
-
14
-
15
-
16
-
17
-
18
-
19
-
20
-
21
-
22
-
23
-
24
-
25
-
26
-
27
-
28
-
29
-
30
-
31
-
32
-
33
-
34
-
35
-
36
-
37
-
38
-
39
-
40
-
41
-
42
-
43
-
44
-
45
-
46
-
47
-
48
-
49
-
50
-
51
-
52
-
53
-
54
-
55
-
56
-
57
-
58
-
59
-
60
-
61
-
62
-
63
-
64
-
65
-
66
-
67
-
68
-
69
-
70
-
71
-
72
-
73
-
74
-
75
-
76
-
77
-
78
-
79
-
80
-
81
-
82
-
83
-
84
-
85
-
86
-
87
-
88
-
89
-
90
-
91
-
92
-
93
-
94
-
95
-
96
-
97
-
98
-
99
-
100
-
101
-
102
-
103
-
104
-
105
-
106
-
107
-
108
-
109
-
110
-
111
-
112
-
113
-
114
-
115
-
116
-
117
-
118
-
119
-
120
-
121
-
122
-
123
-
124
-
125
-
126
-
127
-
128
-
129
-
130
-
 131
131 -
 132
132 -
 133
133 -
 134
134 -
 135
135 -
 136
136 -
 137
137 -
 138
138 -
 139
139 -
 140
140 -
 141
141 -
 142
142 -
 143
143 -
 144
144 -
 145
145 -
 146
146 -
 147
147 -
 148
148 -
 149
149 -
 150
150 -
 151
151 -
152
-
153
-
154
-
155
-
156
-
157
-
158
-
159
-
160
-
161
-
162
-
163
-
164
-
165
-
166
-
167
-
168
-
169
-
170
-
171
-
172
 |
 |

Table of Contents
UNITED ONLINE, INC.
NOTES TO CONSOLIDATED FINANCIAL STATEMENTS (Continued)
9. STOCK-BASED COMPENSATION PLANS (Continued)
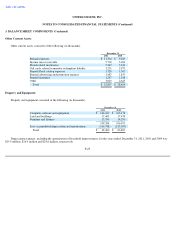
available for grant by 2.5 shares and cancellations of such shares increase the shares available for grant by 2.5 shares.
At December 31, 2011, there were 19.7 million aggregate shares reserved for issuance and 13.6 million shares available for grant under the
Plan.
Stock-Based Compensation
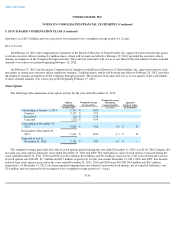
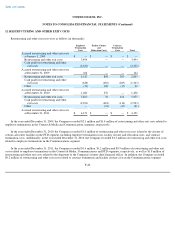
The following table summarizes the stock-based compensation that has been included in the following line items within the consolidated
statements of operations for each of the periods presented (in thousands):
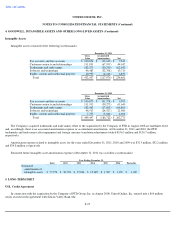
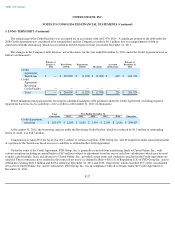
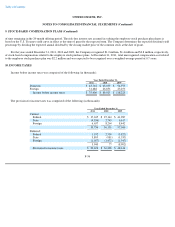
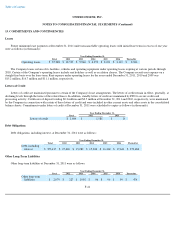
Restricted Stock Units
The following table summarizes activity for restricted stock units for the year ended December 31, 2011:
The weighted-average grant date fair value of restricted stock units granted during the years ended December 31, 2011, 2010 and 2009 was
$6.93, $6.08 and $6.09, respectively. The fair value of restricted stock units that vested during the years ended December 31, 2011, 2010 and
2009 was $19.8 million, $24.7 million and $18.5 million, respectively. At December 31, 2011, the intrinsic value of nonvested restricted stock
units was $18.4 million. At December 31, 2011, nonvested restricted stock units expected to vest totaled 3.1 million with an intrinsic value
totaling $16.7 million. At December 31, 2011, total unrecognized compensation cost related to nonvested restricted stock units, net of expected
F-33
Year Ended December 31,
2011 2010 2009
Operating expenses:
Cost of revenues
-
products
$
46
$
41
$
43
Cost of revenues
-
services
354
502
943
Sales and marketing
2,329
3,957
5,472
Technology and development
2,159
3,109
4,856
General and administrative
12,325
19,434
28,766
Total stock
-
based compensation
$
17,213
$
27,043
$
40,080
Tax benefit recognized
$
4,172
$
5,262
$
7,890
Restricted Stock Units
Weighted-Average
Grant Date Fair
Value
(in thousands)
Nonvested at January 1, 2011
5,537
$
8.13
Granted
1,810
$
6.93
Vested
(3,012
)
$
9.55
Canceled
(946
)
$
6.73
Nonvested at December 31, 2011
3,389
$
6.60