NetZero 2011 Annual Report Download - page 110
Download and view the complete annual report
Please find page 110 of the 2011 NetZero annual report below. You can navigate through the pages in the report by either clicking on the pages listed below, or by using the keyword search tool below to find specific information within the annual report.-
 1
1 -
2
-
3
-
4
-
5
-
6
-
7
-
8
-
9
-
10
-
11
-
12
-
13
-
14
-
15
-
16
-
17
-
18
-
19
-
20
-
21
-
22
-
23
-
24
-
25
-
26
-
27
-
28
-
29
-
30
-
31
-
32
-
33
-
34
-
35
-
36
-
37
-
38
-
39
-
40
-
41
-
42
-
43
-
44
-
45
-
46
-
47
-
48
-
49
-
50
-
51
-
52
-
53
-
54
-
55
-
56
-
57
-
58
-
59
-
60
-
61
-
62
-
63
-
64
-
65
-
66
-
67
-
68
-
69
-
70
-
71
-
72
-
73
-
74
-
75
-
76
-
77
-
78
-
79
-
80
-
81
-
82
-
83
-
84
-
85
-
86
-
87
-
88
-
89
-
90
-
91
-
92
-
93
-
94
-
95
-
96
-
97
-
98
-
99
-
 100
100 -
 101
101 -
 102
102 -
 103
103 -
 104
104 -
 105
105 -
 106
106 -
 107
107 -
 108
108 -
 109
109 -
 110
110 -
 111
111 -
 112
112 -
 113
113 -
 114
114 -
 115
115 -
 116
116 -
 117
117 -
 118
118 -
 119
119 -
 120
120 -
121
-
122
-
123
-
124
-
125
-
126
-
127
-
128
-
129
-
130
-
131
-
132
-
133
-
134
-
135
-
136
-
137
-
138
-
139
-
140
-
141
-
142
-
143
-
144
-
145
-
146
-
147
-
148
-
149
-
150
-
151
-
152
-
153
-
154
-
155
-
156
-
157
-
158
-
159
-
160
-
161
-
162
-
163
-
164
-
165
-
166
-
167
-
168
-
169
-
170
-
171
-
172
 |
 |

Table of Contents
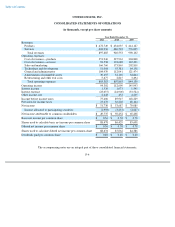
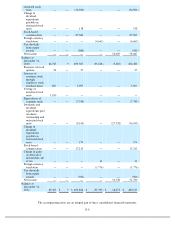
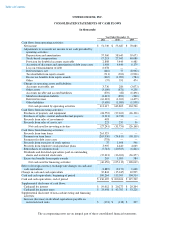
UNITED ONLINE, INC.
CONSOLIDATED STATEMENTS OF OPERATIONS
(in thousands, except per share amounts)
The accompanying notes are an integral part of these consolidated financial statements.
F-4
Year Ended December 31,
2011 2010 2009
Revenues:
Products
$
472,749
$
434,035
$
414,127
Services
424,936
486,518
576,005
Total revenues
897,685
920,553
990,132
Operating expenses:
Cost of revenues
—
products
351,946
327,963
304,868
Cost of revenues
—
services
92,538
101,688
112,491
Sales and marketing
166,760
175,865
202,810
Technology and development
51,068
55,381
64,158
General and administrative
104,939
112,041
121,474
Amortization of intangible assets
30,455
32,110
34,844
Restructuring and other exit costs
5,677
2,815
3,494
Total operating expenses
803,383
807,863
844,139
Operating income
94,302
112,690
145,993
Interest income
1,536
1,673
1,545
Interest expense
(23,075
)
(24,900
)
(33,524
)
Other income, net
2,643
452
4,215
Income before income taxes
75,406
89,915
118,229
Provision for income taxes
23,676
36,228
48,144
Net income
$
51,730
$
53,687
$
70,085
Income allocated to participating securities
(1,993
)
(3,233
)
(4,647
)
Net income attributable to common stockholders
$
49,737
$
50,454
$
65,438
Basic net income per common share
$
0.56
$
0.58
$
0.78
Shares used to calculate basic net income per common share
88,478
86,429
83,698
Diluted net income per common share
$
0.56
$
0.58
$
0.78
Shares used to calculate diluted net income per common share
88,631
87,062
84,386
Dividends paid per common share
$
0.40
$
0.40
$
0.40