NetZero 2011 Annual Report Download - page 46
Download and view the complete annual report
Please find page 46 of the 2011 NetZero annual report below. You can navigate through the pages in the report by either clicking on the pages listed below, or by using the keyword search tool below to find specific information within the annual report.-
 1
1 -
2
-
3
-
4
-
5
-
6
-
7
-
8
-
9
-
10
-
11
-
12
-
13
-
14
-
15
-
16
-
17
-
18
-
19
-
20
-
21
-
22
-
23
-
24
-
25
-
26
-
27
-
28
-
29
-
30
-
31
-
32
-
33
-
34
-
35
-
 36
36 -
 37
37 -
 38
38 -
 39
39 -
 40
40 -
 41
41 -
 42
42 -
 43
43 -
 44
44 -
 45
45 -
 46
46 -
 47
47 -
 48
48 -
 49
49 -
 50
50 -
 51
51 -
 52
52 -
 53
53 -
 54
54 -
 55
55 -
 56
56 -
57
-
58
-
59
-
60
-
61
-
62
-
63
-
64
-
65
-
66
-
67
-
68
-
69
-
70
-
71
-
72
-
73
-
74
-
75
-
76
-
77
-
78
-
79
-
80
-
81
-
82
-
83
-
84
-
85
-
86
-
87
-
88
-
89
-
90
-
91
-
92
-
93
-
94
-
95
-
96
-
97
-
98
-
99
-
100
-
101
-
102
-
103
-
104
-
105
-
106
-
107
-
108
-
109
-
110
-
111
-
112
-
113
-
114
-
115
-
116
-
117
-
118
-
119
-
120
-
121
-
122
-
123
-
124
-
125
-
126
-
127
-
128
-
129
-
130
-
131
-
132
-
133
-
134
-
135
-
136
-
137
-
138
-
139
-
140
-
141
-
142
-
143
-
144
-
145
-
146
-
147
-
148
-
149
-
150
-
151
-
152
-
153
-
154
-
155
-
156
-
157
-
158
-
159
-
160
-
161
-
162
-
163
-
164
-
165
-
166
-
167
-
168
-
169
-
170
-
171
-
172
 |
 |

Table of Contents
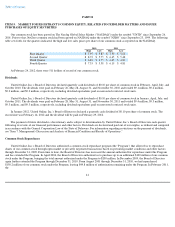
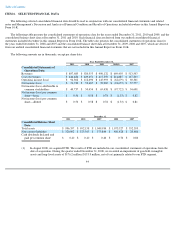
ITEM 6. SELECTED FINANCIAL DATA
The following selected consolidated financial data should be read in conjunction with our consolidated financial statements and related
notes and Management's Discussion and Analysis of Financial Condition and Results of Operations included elsewhere in this Annual Report on
Form 10-K.
The following table presents the consolidated statements of operations data for the years ended December 31, 2011, 2010 and 2009, and the
consolidated balance sheet data at December 31, 2011 and 2010. Such financial data are derived from our audited consolidated financial
statements included elsewhere in this Annual Report on Form 10-K. The table also presents the consolidated statements of operations data for
the years ended December 31, 2008 and 2007 and the consolidated balance sheet data at December 31, 2009, 2008 and 2007, which are derived
from our audited consolidated financial statements that are not included in this Annual Report on Form 10-K.
The following amounts are in thousands, except per share data:
44
Year Ended December 31,
2011
2010
2009
2008(1)
2007
Consolidated Statements of
Operations Data:
Revenues
$
897,685
$
920,553
$
990,132
$
669,403
$
513,503
Cost of revenues
$
444,484
$
429,651
$
417,359
$
214,887
$
117,203
Operating income (loss)
$
94,302
$
112,690
$
145,993
$
(62,679
)
$
92,301
Net income (loss)
$
51,730
$
53,687
$
70,085
$
(94,657
)
$
57,777
Net income (loss) attributable to
common stockholders
$
49,737
$
50,454
$
65,438
$
(97,722
)
$
54,698
Net income (loss) per common
share
—
basic
$
0.56
$
0.58
$
0.78
$
(1.33
)
$
0.82
Net income (loss) per common
share
—
diluted
$
0.56
$
0.58
$
0.78
$
(1.33
)
$
0.81
December 31,
2011 2010 2009 2008 2007
Consolidated Balance Sheet
Data:
Total assets
$
996,357
$
992,158
$
1,049,934
$
1,073,527
$
552,393
Non
-
current liabilities
$
320,092
$
325,565
$
375,844
$
481,428
$
20,486
Cash dividends declared and
paid per common share
$
0.40
$
0.40
$
0.40
$
0.70
$
0.80
(1) In August 2008, we acquired FTD. The results of FTD are included in our consolidated statements of operations from the
date of acquisition. During the quarter ended December 31, 2008, we recorded an impairment of goodwill, intangible
assets and long
-
lived assets of $176.2 million ($153.9 million, net of tax) primarily related to our FTD segment.