NetZero 2011 Annual Report Download - page 61
Download and view the complete annual report
Please find page 61 of the 2011 NetZero annual report below. You can navigate through the pages in the report by either clicking on the pages listed below, or by using the keyword search tool below to find specific information within the annual report.-
 1
1 -
2
-
3
-
4
-
5
-
6
-
7
-
8
-
9
-
10
-
11
-
12
-
13
-
14
-
15
-
16
-
17
-
18
-
19
-
20
-
21
-
22
-
23
-
24
-
25
-
26
-
27
-
28
-
29
-
30
-
31
-
32
-
33
-
34
-
35
-
36
-
37
-
38
-
39
-
40
-
41
-
42
-
43
-
44
-
45
-
46
-
47
-
48
-
49
-
50
-
 51
51 -
 52
52 -
 53
53 -
 54
54 -
 55
55 -
 56
56 -
 57
57 -
 58
58 -
 59
59 -
 60
60 -
 61
61 -
 62
62 -
 63
63 -
 64
64 -
 65
65 -
 66
66 -
 67
67 -
 68
68 -
 69
69 -
 70
70 -
 71
71 -
72
-
73
-
74
-
75
-
76
-
77
-
78
-
79
-
80
-
81
-
82
-
83
-
84
-
85
-
86
-
87
-
88
-
89
-
90
-
91
-
92
-
93
-
94
-
95
-
96
-
97
-
98
-
99
-
100
-
101
-
102
-
103
-
104
-
105
-
106
-
107
-
108
-
109
-
110
-
111
-
112
-
113
-
114
-
115
-
116
-
117
-
118
-
119
-
120
-
121
-
122
-
123
-
124
-
125
-
126
-
127
-
128
-
129
-
130
-
131
-
132
-
133
-
134
-
135
-
136
-
137
-
138
-
139
-
140
-
141
-
142
-
143
-
144
-
145
-
146
-
147
-
148
-
149
-
150
-
151
-
152
-
153
-
154
-
155
-
156
-
157
-
158
-
159
-
160
-
161
-
162
-
163
-
164
-
165
-
166
-
167
-
168
-
169
-
170
-
171
-
172
 |
 |

Table of Contents
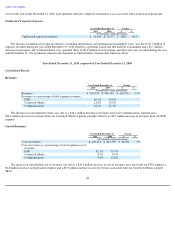
Other Income (Expense), Net
Other income (expense), net, consists of gains and losses on foreign currency exchange rate transactions; realized and unrealized gains and
losses on certain forward foreign currency exchange contracts; equity earnings on investments in subsidiaries; and other non-operating income
and expenses.
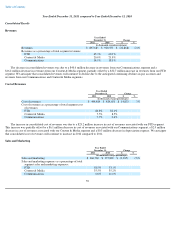
Results of Operations
The following tables set forth, for the periods presented, selected historical statements of operations and segment information data. The
information contained in the tables below should be read in conjunction with Critical Accounting Policies, Estimates and Assumptions, Liquidity
and Capital Resources, Contractual Obligations, and Other Commitments included in this Item 7 as well as "Quantitative and Qualitative
Disclosures About Market Risk" and the consolidated financial statements and notes thereto included elsewhere in this Annual Report on
Form 10-K.
Consolidated information was as follows (in thousands):
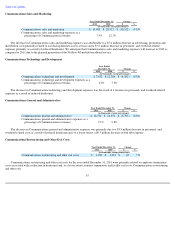
Information for our three reportable segments, which excludes depreciation and amortization of intangible assets, was as follows (in
thousands):
58
Year Ended December 31,
2011
2010
2009
Revenues
$
897,685
$
920,553
$
990,132
Operating expenses:
Cost of revenues
444,484
429,651
417,359
Sales and marketing
166,760
175,865
202,810
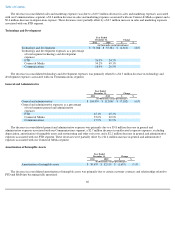
Technology and development
51,068
55,381
64,158
General and administrative
104,939
112,041
121,474
Amortization of intangible assets
30,455
32,110
34,844
Restructuring and other exit costs
5,677
2,815
3,494
Total operating expenses
803,383
807,863
844,139
Operating income
94,302
112,690
145,993
Interest income
1,536
1,673
1,545
Interest expense
(23,075
)
(24,900
)
(33,524
)
Other income, net
2,643
452
4,215
Income before income taxes
75,406
89,915
118,229
Provision for income taxes
23,676
36,228
48,144
Net income
$
51,730
$
53,687
$
70,085
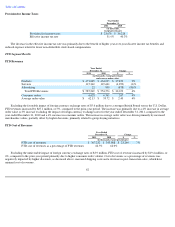
FTD
Content & Media
Communications
Year Ended December 31,
Year Ended December 31,
Year Ended December 31,
2011
2010
2009
2011
2010
2009
2011
2010
2009
Revenues
$
587,249
$
554,576
$
545,845
$
185,475
$
201,644
$
236,022
$
126,532
$
167,153
$
211,233
Operating
expenses:
Cost of
revenues
367,232
343,988
323,581
32,575
35,514
35,014
33,442
39,573
48,671
Sales and
marketing
97,512
93,782
89,720
59,063
62,226
74,819
10,009
20,521
39,802
Technology
and
development
11,294
11,190
11,868
22,751
22,803
25,535
7,932
12,284
18,468
General and
administrative
31,675
33,844
33,273
26,020
24,574
29,443
12,554
16,351
19,107
Restructuring
and other
exit costs
876
1,574
—
1,616
(91
)
2,121
1,399
1,332
1,373
Total
operating
expenses
508,589
484,378
458,442
142,025
145,026
166,932
65,336
90,061
127,421
Segment income
from
operations
$
78,660
$
70,198
$
87,403
$
43,450
$
56,618
$
69,090
$
61,196
$
77,092
$
83,812