NetZero 2011 Annual Report Download - page 48
Download and view the complete annual report
Please find page 48 of the 2011 NetZero annual report below. You can navigate through the pages in the report by either clicking on the pages listed below, or by using the keyword search tool below to find specific information within the annual report.-
 1
1 -
2
-
3
-
4
-
5
-
6
-
7
-
8
-
9
-
10
-
11
-
12
-
13
-
14
-
15
-
16
-
17
-
18
-
19
-
20
-
21
-
22
-
23
-
24
-
25
-
26
-
27
-
28
-
29
-
30
-
31
-
32
-
33
-
34
-
35
-
36
-
37
-
 38
38 -
 39
39 -
 40
40 -
 41
41 -
 42
42 -
 43
43 -
 44
44 -
 45
45 -
 46
46 -
 47
47 -
 48
48 -
 49
49 -
 50
50 -
 51
51 -
 52
52 -
 53
53 -
 54
54 -
 55
55 -
 56
56 -
 57
57 -
 58
58 -
59
-
60
-
61
-
62
-
63
-
64
-
65
-
66
-
67
-
68
-
69
-
70
-
71
-
72
-
73
-
74
-
75
-
76
-
77
-
78
-
79
-
80
-
81
-
82
-
83
-
84
-
85
-
86
-
87
-
88
-
89
-
90
-
91
-
92
-
93
-
94
-
95
-
96
-
97
-
98
-
99
-
100
-
101
-
102
-
103
-
104
-
105
-
106
-
107
-
108
-
109
-
110
-
111
-
112
-
113
-
114
-
115
-
116
-
117
-
118
-
119
-
120
-
121
-
122
-
123
-
124
-
125
-
126
-
127
-
128
-
129
-
130
-
131
-
132
-
133
-
134
-
135
-
136
-
137
-
138
-
139
-
140
-
141
-
142
-
143
-
144
-
145
-
146
-
147
-
148
-
149
-
150
-
151
-
152
-
153
-
154
-
155
-
156
-
157
-
158
-
159
-
160
-
161
-
162
-
163
-
164
-
165
-
166
-
167
-
168
-
169
-
170
-
171
-
172
 |
 |

Table of Contents
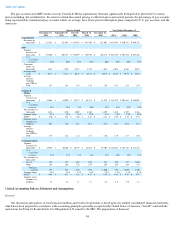
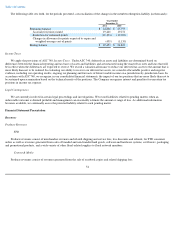
Effective in the first quarter of 2011, we modified how we report segment information to the chief operating decision maker. Our segment
reporting now separately reports unallocated corporate expenses. Previously, such expenses were fully allocated to our reportable segments. We
have disclosed revised prior period results to conform to the current year presentation.
Key Business Metrics
We review a number of key business metrics to help us monitor our performance and trends affecting our businesses, and to develop
forecasts and budgets. These key measures are:
FTD Segment Metrics
Consumer Orders. We monitor the number of consumer orders for floral and gift products during a given period. Consumer orders are
orders delivered during the period that originated in the U.S. and Canada, primarily from the www.ftd.com and www.ftd.ca websites and the 1-
800-SEND-FTD telephone number, and in the U.K. and the Republic of Ireland, primarily from the www.interflora.co.uk and www.interflora.ie
websites and various telephone numbers. The number of consumer orders is not adjusted for non-delivered orders that are refunded after the
scheduled delivery. Orders originating with a florist or other retail location for delivery to consumers are not included. The number of consumer
orders received may fluctuate significantly from period to period due to seasonality resulting from the timing of key holidays; general economic
conditions; fluctuations in marketing expenditures on initiatives designed to attract new and retain existing customers; changes in pricing for our
floral, plant and gift products or competitive offerings; new or terminated partnerships; and changing consumer preferences, among other factors.
Average Order Value. We monitor the average value for consumer orders delivered in a given period, which we refer to as the average
order value. Average order value represents the average U.S. Dollar amount received for consumer orders delivered during a period. This
average U.S. Dollar amount is determined after translating local currency amounts received for orders delivered principally in the U.K. and the
Republic of Ireland into U.S. Dollars. Average order value includes merchandise revenues and shipping and service fees paid by the consumer,
less discounts and refunds (net of refund-related fees charged to floral network members). Average order values may fluctuate from period to
period based on the average foreign currency exchange rates; product mix; changes in merchandise pricing, shipping and service fees; levels of
refunds issued; and discounts, among other factors.
Content & Media and Communications Segment Metrics
Pay Accounts. We generate a significant portion of our revenues from our pay accounts and they represent one of the most important
drivers of our business model. A pay account is defined as a member who has paid for a subscription to a Content & Media or Communications
service, and whose subscription has not terminated or expired. A subscription provides the member with access to our service for a specific term
(for example, a month or a year) and may be renewed upon the expiration of each term. One time purchases of our services, such as Memory
Lane's one-day All-Access Pass, are not considered subscriptions and thus, are not included in the pay accounts metric. A pay account does not
equate to a unique subscriber since one subscriber could have several pay accounts. At any point in time, our pay account base includes a
number of accounts receiving a free period of service as either a promotion or retention tool and a number of accounts that have notified us that
they are terminating their service but whose service remains in effect. In general, the key metrics that affect our revenues from our pay accounts
base include the number of pay accounts and ARPU. A pay account generally becomes a free account following the expiration or termination of
the related subscription.
ARPU. We monitor ARPU, which is a monthly measure calculated by dividing services revenues generated from the pay accounts of our
Content & Media or Communications segment, as applicable,
46