NetZero 2011 Annual Report Download - page 71
Download and view the complete annual report
Please find page 71 of the 2011 NetZero annual report below. You can navigate through the pages in the report by either clicking on the pages listed below, or by using the keyword search tool below to find specific information within the annual report.-
 1
1 -
2
-
3
-
4
-
5
-
6
-
7
-
8
-
9
-
10
-
11
-
12
-
13
-
14
-
15
-
16
-
17
-
18
-
19
-
20
-
21
-
22
-
23
-
24
-
25
-
26
-
27
-
28
-
29
-
30
-
31
-
32
-
33
-
34
-
35
-
36
-
37
-
38
-
39
-
40
-
41
-
42
-
43
-
44
-
45
-
46
-
47
-
48
-
49
-
50
-
51
-
52
-
53
-
54
-
55
-
56
-
57
-
58
-
59
-
60
-
 61
61 -
 62
62 -
 63
63 -
 64
64 -
 65
65 -
 66
66 -
 67
67 -
 68
68 -
 69
69 -
 70
70 -
 71
71 -
 72
72 -
 73
73 -
 74
74 -
 75
75 -
 76
76 -
 77
77 -
 78
78 -
 79
79 -
 80
80 -
 81
81 -
82
-
83
-
84
-
85
-
86
-
87
-
88
-
89
-
90
-
91
-
92
-
93
-
94
-
95
-
96
-
97
-
98
-
99
-
100
-
101
-
102
-
103
-
104
-
105
-
106
-
107
-
108
-
109
-
110
-
111
-
112
-
113
-
114
-
115
-
116
-
117
-
118
-
119
-
120
-
121
-
122
-
123
-
124
-
125
-
126
-
127
-
128
-
129
-
130
-
131
-
132
-
133
-
134
-
135
-
136
-
137
-
138
-
139
-
140
-
141
-
142
-
143
-
144
-
145
-
146
-
147
-
148
-
149
-
150
-
151
-
152
-
153
-
154
-
155
-
156
-
157
-
158
-
159
-
160
-
161
-
162
-
163
-
164
-
165
-
166
-
167
-
168
-
169
-
170
-
171
-
172
 |
 |

Table of Contents
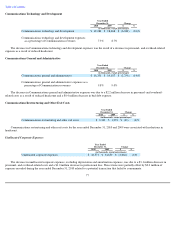
costs for the year ended December 31, 2010 were primarily related to employee termination costs associated with a reduction in headcount.
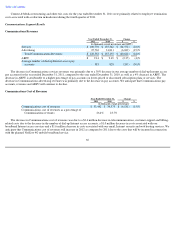
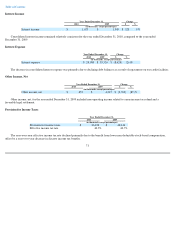
Unallocated Corporate Expenses
The decrease in unallocated corporate expenses, excluding depreciation and amortization of intangible assets, was due to $2.0 million of
expenses recorded during the year ended December 31, 2010 related to a potential transaction that failed to consummate and a $0.7 million
decrease in personnel- and overhead-related costs, partially offset by $1.8 million of restructuring and other exit costs recorded during the year
ended December 31, 2011 primarily related to the departure of United Online's former chief financial officer.
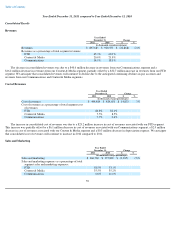
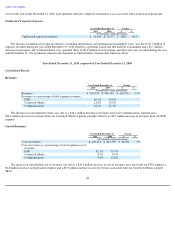
Year Ended December 31, 2010 compared to Year Ended December 31, 2009
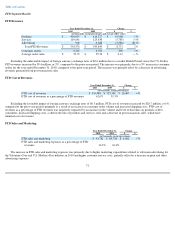
Consolidated Results
Revenues
The decrease in consolidated revenues was due to a $44.1 million decrease in revenues from our Communications segment and a
$34.4 million decrease in revenues from our Content & Media segment, partially offset by an $8.7 million increase in revenues from our FTD
segment.
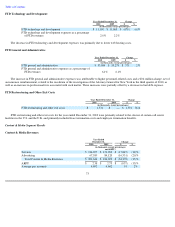
Cost of Revenues
The increase in consolidated cost of revenues was due to a $20.4 million increase in cost of revenues associated with our FTD segment, a
$0.8 million increase in depreciation expense and a $0.5 million increase in cost of revenues associated with our Content & Media segment.
These
68
Year Ended December 31,
Change
2011
2010
$
%
(in thousands, except percentages)
Unallocated corporate expenses
$
31,644
$
32,573
$
(929
)
(3
)%
Year Ended December 31, Change
2010 2009 $ %
(in thousands, except percentages)
Revenues
$
920,553
$
990,132
$
(69,579
)
(7
)%
Revenues as a percentage of total segment revenues:
FTD
60.1
%
55.0
%
Content & Media
21.8
%
23.8
%
Communications
18.1
%
21.3
%
Year Ended December 31,
Change
2010
2009
$
%
(in thousands, except percentages)
Cost of revenues
$
429,651
$
417,359
$
12,292
3
%
Cost of revenues as a percentage of total segment cost of
revenues:
FTD
82.1
%
79.5
%
Content & Media
8.5
%
8.6
%
Communications
9.4
%
12.0
%