NetZero 2011 Annual Report Download - page 75
Download and view the complete annual report
Please find page 75 of the 2011 NetZero annual report below. You can navigate through the pages in the report by either clicking on the pages listed below, or by using the keyword search tool below to find specific information within the annual report.-
 1
1 -
2
-
3
-
4
-
5
-
6
-
7
-
8
-
9
-
10
-
11
-
12
-
13
-
14
-
15
-
16
-
17
-
18
-
19
-
20
-
21
-
22
-
23
-
24
-
25
-
26
-
27
-
28
-
29
-
30
-
31
-
32
-
33
-
34
-
35
-
36
-
37
-
38
-
39
-
40
-
41
-
42
-
43
-
44
-
45
-
46
-
47
-
48
-
49
-
50
-
51
-
52
-
53
-
54
-
55
-
56
-
57
-
58
-
59
-
60
-
61
-
62
-
63
-
64
-
 65
65 -
 66
66 -
 67
67 -
 68
68 -
 69
69 -
 70
70 -
 71
71 -
 72
72 -
 73
73 -
 74
74 -
 75
75 -
 76
76 -
 77
77 -
 78
78 -
 79
79 -
 80
80 -
 81
81 -
 82
82 -
 83
83 -
 84
84 -
 85
85 -
86
-
87
-
88
-
89
-
90
-
91
-
92
-
93
-
94
-
95
-
96
-
97
-
98
-
99
-
100
-
101
-
102
-
103
-
104
-
105
-
106
-
107
-
108
-
109
-
110
-
111
-
112
-
113
-
114
-
115
-
116
-
117
-
118
-
119
-
120
-
121
-
122
-
123
-
124
-
125
-
126
-
127
-
128
-
129
-
130
-
131
-
132
-
133
-
134
-
135
-
136
-
137
-
138
-
139
-
140
-
141
-
142
-
143
-
144
-
145
-
146
-
147
-
148
-
149
-
150
-
151
-
152
-
153
-
154
-
155
-
156
-
157
-
158
-
159
-
160
-
161
-
162
-
163
-
164
-
165
-
166
-
167
-
168
-
169
-
170
-
171
-
172
 |
 |

Table of Contents
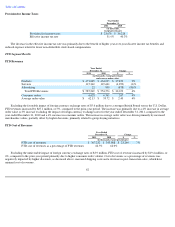
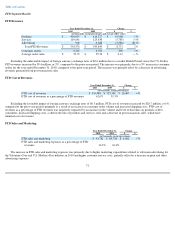
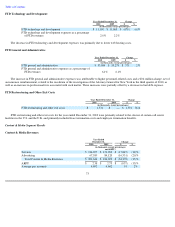
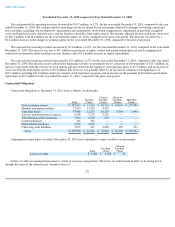
FTD Segment Results
FTD Revenues
Excluding the unfavorable impact of foreign currency exchange rates of $0.6 million due to a weaker British Pound versus the U.S. Dollar,
FTD revenues increased by $9.4 million, or 2%, compared to the prior-
year period. The increase was primarily due to a 5% increase in consumer
orders for the year ended December 31, 2010, compared to the prior-year period. The increase was partially offset by a decrease in advertising
revenues generated from post-transaction sales.
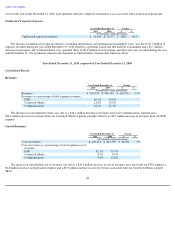
FTD Cost of Revenues
Excluding the favorable impact of foreign currency exchange rates of $0.3 million, FTD cost of revenues increased by $20.7 million, or 6%,
compared to the prior-year period, primarily as a result of an increase in consumer order volume and increased shipping costs. FTD cost of
revenues as a percentage of FTD revenues was negatively impacted by an increase in the volume and level of discounts on products sold to
consumers, increased shipping costs, a shift in the mix of products and services sold, and a decrease in post-transaction sales, which have
minimal cost of revenues.
FTD Sales and Marketing
The increase in FTD sales and marketing expenses was primarily due to higher marketing expenditures related to television advertising for
the Valentine's Day and U.S. Mother's Day holidays in 2010 and higher customer service costs, partially offset by a decrease in print and other
advertising expenses.
72
Year Ended December 31, Change
2010
2009
$
%
(in thousands, except percentages and average order value)
Products
$
434,035
$
414,127
$
19,908
5
%
Services
119,641
125,430
(5,789
)
(5
)%
Advertising
900
6,288
(5,388
)
(86
)%
Total FTD Revenues
$
554,576
$
545,845
$
8,731
2
%
Consumer orders
6,361
6,071
290
5
%
Average order value
$
59.72
$
59.56
$
0.16
—
%
Year Ended December 31,
Change
2010 2009 $ %
(in thousands, except percentages)
FTD cost of revenues
$
343,988
$
323,581
$
20,407
6
%
FTD cost of revenues as a percentage of FTD revenues
62.0
%
59.3
%
Year Ended December 31,
Change
2010
2009
$
%
(in thousands, except percentages)
FTD sales and marketing
$
93,782
$
89,720
$
4,062
5
%
FTD sales and marketing expenses as a percentage of FTD
revenues
16.9
%
16.4
%