NetZero 2011 Annual Report Download - page 68
Download and view the complete annual report
Please find page 68 of the 2011 NetZero annual report below. You can navigate through the pages in the report by either clicking on the pages listed below, or by using the keyword search tool below to find specific information within the annual report.-
 1
1 -
2
-
3
-
4
-
5
-
6
-
7
-
8
-
9
-
10
-
11
-
12
-
13
-
14
-
15
-
16
-
17
-
18
-
19
-
20
-
21
-
22
-
23
-
24
-
25
-
26
-
27
-
28
-
29
-
30
-
31
-
32
-
33
-
34
-
35
-
36
-
37
-
38
-
39
-
40
-
41
-
42
-
43
-
44
-
45
-
46
-
47
-
48
-
49
-
50
-
51
-
52
-
53
-
54
-
55
-
56
-
57
-
 58
58 -
 59
59 -
 60
60 -
 61
61 -
 62
62 -
 63
63 -
 64
64 -
 65
65 -
 66
66 -
 67
67 -
 68
68 -
 69
69 -
 70
70 -
 71
71 -
 72
72 -
 73
73 -
 74
74 -
 75
75 -
 76
76 -
 77
77 -
 78
78 -
79
-
80
-
81
-
82
-
83
-
84
-
85
-
86
-
87
-
88
-
89
-
90
-
91
-
92
-
93
-
94
-
95
-
96
-
97
-
98
-
99
-
100
-
101
-
102
-
103
-
104
-
105
-
106
-
107
-
108
-
109
-
110
-
111
-
112
-
113
-
114
-
115
-
116
-
117
-
118
-
119
-
120
-
121
-
122
-
123
-
124
-
125
-
126
-
127
-
128
-
129
-
130
-
131
-
132
-
133
-
134
-
135
-
136
-
137
-
138
-
139
-
140
-
141
-
142
-
143
-
144
-
145
-
146
-
147
-
148
-
149
-
150
-
151
-
152
-
153
-
154
-
155
-
156
-
157
-
158
-
159
-
160
-
161
-
162
-
163
-
164
-
165
-
166
-
167
-
168
-
169
-
170
-
171
-
172
 |
 |

Table of Contents
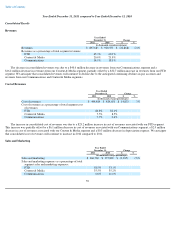
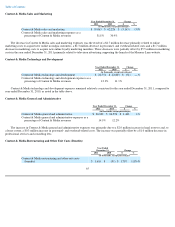
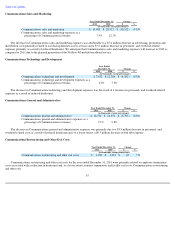
Content & Media Sales and Marketing
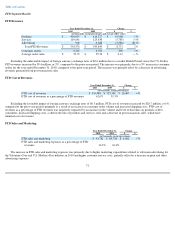
The decrease in Content & Media sales and marketing expenses was the result of a $4.7 million decrease primarily related to online
marketing costs to acquire new online nostalgia customers, a $2.3 million decrease in personnel- and overhead-related costs and a $1.7 million
decrease in marketing costs to acquire new online loyalty marketing members. These decreases were partially offset by $5.5 million in marketing
costs in the year ended December 31, 2011 primarily related to television advertising supporting the launch of the Memory Lane website.
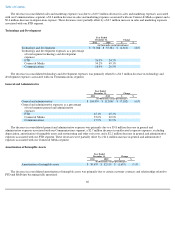
Content & Media Technology and Development
Content & Media technology and development expenses remained relatively consistent for the year ended December 31, 2011, compared to
year ended December 31, 2010, as noted in the table above.
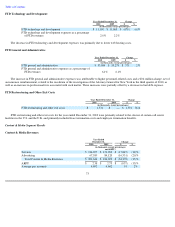
Content & Media General and Administrative
The increase in Content & Media general and administrative expenses was primarily due to a $2.0 million increase in legal reserves and, to
a lesser extent, a $0.3 million increase in personnel- and overhead-related costs. The increase was partially offset by a $1.0 million decrease in
professional services and consulting fees.
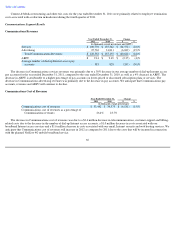
Content & Media Restructuring and Other Exit Costs (Benefits)
65
Year Ended December 31,
Change
2011
2010
$
%
(in thousands, except percentages)
Content & Media sales and marketing
$
59,063
$
62,226
$
(3,163
)
(5
)%
Content & Media sales and marketing expenses as a
percentage of Content & Media revenues
31.8
%
30.9
%
Year Ended December 31,
Change
2011
2010
$
%
(in thousands, except percentages)
Content & Media technology and development
$
22,751
$
22,803
$
(52
)
—
%
Content & Media technology and development expenses as a
percentage of Content & Media revenues
12.3
%
11.3
%
Year Ended December 31,
Change
2011
2010
$
%
(in thousands, except percentages)
Content & Media general and administrative
$
26,020
$
24,574
$
1,446
6
%
Content & Media general and administrative expenses as a
percentage of Content & Media revenues
14.0
%
12.2
%
Year Ended
December 31, Change
2011 2010 $ %
(in thousands, except percentages)
Content & Media restructuring and other exit costs
(benefits)
$
1,616
$
(91
)
$
1,707
1,876
%