NetZero 2011 Annual Report Download - page 63
Download and view the complete annual report
Please find page 63 of the 2011 NetZero annual report below. You can navigate through the pages in the report by either clicking on the pages listed below, or by using the keyword search tool below to find specific information within the annual report.-
 1
1 -
2
-
3
-
4
-
5
-
6
-
7
-
8
-
9
-
10
-
11
-
12
-
13
-
14
-
15
-
16
-
17
-
18
-
19
-
20
-
21
-
22
-
23
-
24
-
25
-
26
-
27
-
28
-
29
-
30
-
31
-
32
-
33
-
34
-
35
-
36
-
37
-
38
-
39
-
40
-
41
-
42
-
43
-
44
-
45
-
46
-
47
-
48
-
49
-
50
-
51
-
52
-
 53
53 -
 54
54 -
 55
55 -
 56
56 -
 57
57 -
 58
58 -
 59
59 -
 60
60 -
 61
61 -
 62
62 -
 63
63 -
 64
64 -
 65
65 -
 66
66 -
 67
67 -
 68
68 -
 69
69 -
 70
70 -
 71
71 -
 72
72 -
 73
73 -
74
-
75
-
76
-
77
-
78
-
79
-
80
-
81
-
82
-
83
-
84
-
85
-
86
-
87
-
88
-
89
-
90
-
91
-
92
-
93
-
94
-
95
-
96
-
97
-
98
-
99
-
100
-
101
-
102
-
103
-
104
-
105
-
106
-
107
-
108
-
109
-
110
-
111
-
112
-
113
-
114
-
115
-
116
-
117
-
118
-
119
-
120
-
121
-
122
-
123
-
124
-
125
-
126
-
127
-
128
-
129
-
130
-
131
-
132
-
133
-
134
-
135
-
136
-
137
-
138
-
139
-
140
-
141
-
142
-
143
-
144
-
145
-
146
-
147
-
148
-
149
-
150
-
151
-
152
-
153
-
154
-
155
-
156
-
157
-
158
-
159
-
160
-
161
-
162
-
163
-
164
-
165
-
166
-
167
-
168
-
169
-
170
-
171
-
172
 |
 |

Table of Contents
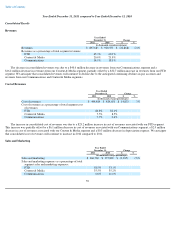
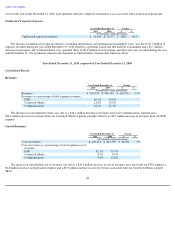
The decrease in consolidated sales and marketing expenses was due to a $10.5 million decrease in sales and marketing expenses associated
with our Communications segment, a $3.2 million decrease in sales and marketing expenses associated with our Content & Media segment and a
$0.4 million decrease in depreciation expense. These decreases were partially offset by a $3.7 million increase in sales and marketing expenses
associated with our FTD segment.
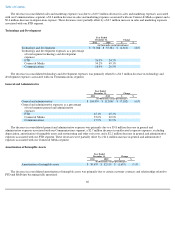
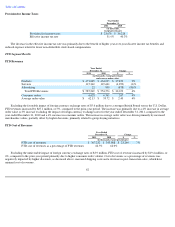
Technology and Development
The decrease in consolidated technology and development expenses was primarily related to a $4.3 million decrease in technology and
development expenses associated with our Communications segment.
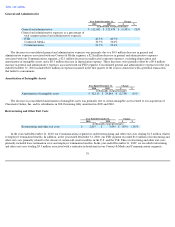
General and Administrative
The decrease in consolidated general and administrative expenses was primarily due to a $3.8 million decrease in general and
administrative expenses associated with our Communications segment, a $2.7 million decrease in unallocated corporate expenses, excluding
depreciation, amortization of intangible assets and restructuring and other exit costs, and a $2.2 million decrease in general and administrative
expenses associated with our FTD segment. These decreases were partially offset by a $1.4 million increase in general and administrative
expenses associated with our Content & Media segment.
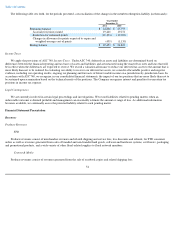
Amortization of Intangible Assets
The decrease in consolidated amortization of intangible assets was primarily due to certain customer contracts and relationships related to
FTD and MyPoints becoming fully amortized.
60
Year Ended
December 31, Change
2011 2010 $ %
(in thousands, except percentages)
Technology and development
$
51,068
$
55,381
$
(4,313
)
(8
)%
Technology and development expenses as a percentage
of total segment technology and development
expenses:
FTD
26.9
%
24.2
%
Content & Media
54.2
%
49.3
%
Communications
18.9
%
26.5
%
Year Ended
December 31, Change
2011 2010 $ %
(in thousands, except percentages)
General and administrative
$
104,939
$
112,041
$
(7,102
)
(6
)%
General and administrative expenses as a percentage
of total segment general and administrative
expenses:
FTD
45.1
%
45.3
%
Content & Media
37.0
%
32.9
%
Communications
17.9
%
21.9
%
Year Ended
December 31, Change
2011 2010 $ %
(in thousands, except percentages)
Amortization of intangible assets
$
30,455
$
32,110
$
(1,655
)
(5
)%