NetZero 2011 Annual Report Download - page 62
Download and view the complete annual report
Please find page 62 of the 2011 NetZero annual report below. You can navigate through the pages in the report by either clicking on the pages listed below, or by using the keyword search tool below to find specific information within the annual report.-
 1
1 -
2
-
3
-
4
-
5
-
6
-
7
-
8
-
9
-
10
-
11
-
12
-
13
-
14
-
15
-
16
-
17
-
18
-
19
-
20
-
21
-
22
-
23
-
24
-
25
-
26
-
27
-
28
-
29
-
30
-
31
-
32
-
33
-
34
-
35
-
36
-
37
-
38
-
39
-
40
-
41
-
42
-
43
-
44
-
45
-
46
-
47
-
48
-
49
-
50
-
51
-
 52
52 -
 53
53 -
 54
54 -
 55
55 -
 56
56 -
 57
57 -
 58
58 -
 59
59 -
 60
60 -
 61
61 -
 62
62 -
 63
63 -
 64
64 -
 65
65 -
 66
66 -
 67
67 -
 68
68 -
 69
69 -
 70
70 -
 71
71 -
 72
72 -
73
-
74
-
75
-
76
-
77
-
78
-
79
-
80
-
81
-
82
-
83
-
84
-
85
-
86
-
87
-
88
-
89
-
90
-
91
-
92
-
93
-
94
-
95
-
96
-
97
-
98
-
99
-
100
-
101
-
102
-
103
-
104
-
105
-
106
-
107
-
108
-
109
-
110
-
111
-
112
-
113
-
114
-
115
-
116
-
117
-
118
-
119
-
120
-
121
-
122
-
123
-
124
-
125
-
126
-
127
-
128
-
129
-
130
-
131
-
132
-
133
-
134
-
135
-
136
-
137
-
138
-
139
-
140
-
141
-
142
-
143
-
144
-
145
-
146
-
147
-
148
-
149
-
150
-
151
-
152
-
153
-
154
-
155
-
156
-
157
-
158
-
159
-
160
-
161
-
162
-
163
-
164
-
165
-
166
-
167
-
168
-
169
-
170
-
171
-
172
 |
 |

Table of Contents
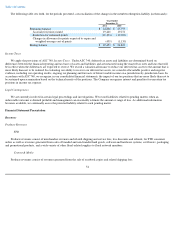
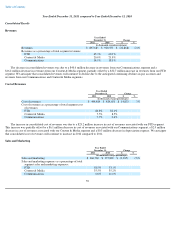
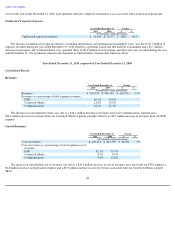
Year Ended December 31, 2011 compared to Year Ended December 31, 2010
Consolidated Results
Revenues
The decrease in consolidated revenues was due to a $40.6 million decrease in revenues from our Communications segment and a
$16.2 million decrease in revenues from our Content & Media segment, partially offset by a $32.7 million increase in revenues from our FTD
segment. We anticipate that consolidated revenues will continue to decline due to the anticipated continuing declines in pay accounts and
revenues from our Communications and Content & Media segments.
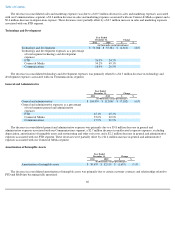
Cost of Revenues
The increase in consolidated cost of revenues was due to a $23.2 million increase in cost of revenues associated with our FTD segment.
This increase was partially offset by a $6.1 million decrease in cost of revenues associated with our Communications segment, a $2.9 million
decrease in cost of revenues associated with our Content & Media segment and a $0.3 million decrease in depreciation expense. We anticipate
that consolidated cost of revenues will continue to increase in 2012 compared to 2011.
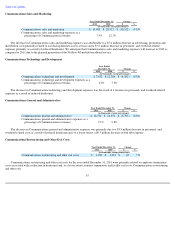
Sales and Marketing
59
Year Ended
December 31,
Change
2011 2010 $ %
(in thousands, except percentages)
Revenues
$
897,685
$
920,553
$
(22,868
)
(2
)%
Revenues as a percentage of total segment revenues:
FTD
65.3
%
60.1
%
Content & Media
20.6
%
21.8
%
Communications
14.1
%
18.1
%
Year Ended
December 31,
Change
2011 2010 $ %
(in thousands, except percentages)
Cost of revenues
$
444,484
$
429,651
$
14,833
3
%
Cost of revenues as a percentage of total segment cost
of revenues:
FTD
84.8
%
82.1
%
Content & Media
7.5
%
8.5
%
Communications
7.7
%
9.4
%
Year Ended
December 31, Change
2011
2010
$
%
(in thousands, except percentages)
Sales and marketing
$
166,760
$
175,865
$
(9,105
)
(5
)%
Sales and marketing expenses as a percentage of total
segment sales and marketing expenses:
FTD
58.5
%
53.1
%
Content & Media
35.5
%
35.2
%
Communications
6.0
%
11.6
%