NetZero 2011 Annual Report Download - page 76
Download and view the complete annual report
Please find page 76 of the 2011 NetZero annual report below. You can navigate through the pages in the report by either clicking on the pages listed below, or by using the keyword search tool below to find specific information within the annual report.-
 1
1 -
2
-
3
-
4
-
5
-
6
-
7
-
8
-
9
-
10
-
11
-
12
-
13
-
14
-
15
-
16
-
17
-
18
-
19
-
20
-
21
-
22
-
23
-
24
-
25
-
26
-
27
-
28
-
29
-
30
-
31
-
32
-
33
-
34
-
35
-
36
-
37
-
38
-
39
-
40
-
41
-
42
-
43
-
44
-
45
-
46
-
47
-
48
-
49
-
50
-
51
-
52
-
53
-
54
-
55
-
56
-
57
-
58
-
59
-
60
-
61
-
62
-
63
-
64
-
65
-
 66
66 -
 67
67 -
 68
68 -
 69
69 -
 70
70 -
 71
71 -
 72
72 -
 73
73 -
 74
74 -
 75
75 -
 76
76 -
 77
77 -
 78
78 -
 79
79 -
 80
80 -
 81
81 -
 82
82 -
 83
83 -
 84
84 -
 85
85 -
 86
86 -
87
-
88
-
89
-
90
-
91
-
92
-
93
-
94
-
95
-
96
-
97
-
98
-
99
-
100
-
101
-
102
-
103
-
104
-
105
-
106
-
107
-
108
-
109
-
110
-
111
-
112
-
113
-
114
-
115
-
116
-
117
-
118
-
119
-
120
-
121
-
122
-
123
-
124
-
125
-
126
-
127
-
128
-
129
-
130
-
131
-
132
-
133
-
134
-
135
-
136
-
137
-
138
-
139
-
140
-
141
-
142
-
143
-
144
-
145
-
146
-
147
-
148
-
149
-
150
-
151
-
152
-
153
-
154
-
155
-
156
-
157
-
158
-
159
-
160
-
161
-
162
-
163
-
164
-
165
-
166
-
167
-
168
-
169
-
170
-
171
-
172
 |
 |

Table of Contents
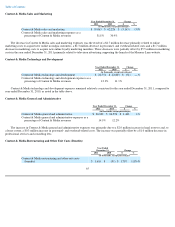
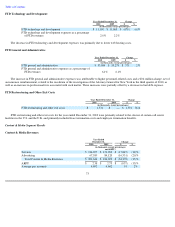
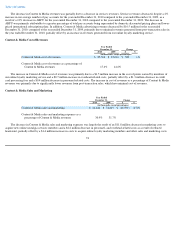
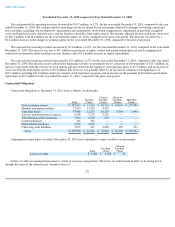
FTD Technology and Development
The decrease in FTD technology and development expenses was primarily due to lower web hosting costs.
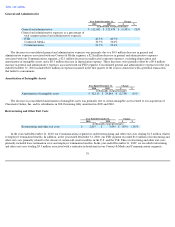
FTD General and Administrative
The increase in FTD general and administrative expenses was attributable to higher personnel-
related costs and a $0.4 million charge, net of
an insurance reimbursement, related to the resolution of the investigation of the Attorney General for New York in the third quarter of 2010, as
well as an increase in professional fees associated with such matter. These increases were partially offset by a decrease in bad debt expense.
FTD Restructuring and Other Exit Costs
FTD restructuring and other exit costs for the year ended December 31, 2010 were primarily related to the closure of certain call center
facilities in the U.S. and the U.K. and primarily included lease termination costs and employee termination benefits.
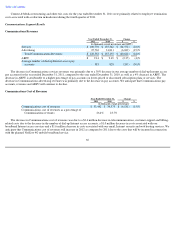
Content & Media Segment Results
Content & Media Revenues
73
Year Ended December 31,
Change
2010
2009
$
%
(in thousands, except percentages)
FTD technology and development
$
11,190
$
11,868
$
(678
)
(6
)%
FTD technology and development expenses as a percentage
of FTD revenues
2.0
%
2.2
%
Year Ended December 31,
Change
2010
2009
$
%
(in thousands, except percentages)
FTD general and administrative
$
33,844
$
33,273
$
571
2
%
FTD general and administrative expenses as a percentage of
FTD revenues
6.1
%
6.1
%
Year Ended December 31,
Change
2010
2009
$
%
(in thousands, except percentages)
FTD restructuring and other exit costs
$
1,574
$
—
$
1,574
N/A
Year Ended
December 31, Change
2010
2009
$
%
(in thousands, except percentages
and ARPU)
Services
$
134,055
$
151,902
$
(17,847
)
(12
)%
Advertising
67,589
84,120
(16,531
)
(20
)%
Total Content & Media Revenues
$
201,644
$
236,022
$
(34,378
)
(15
)%
ARPU
$
2.38
$
2.75
$
(0.37
)
(13
)%
Average pay accounts
4,693
4,602
91
2
%