NetFlix 2005 Annual Report Download - page 70
Download and view the complete annual report
Please find page 70 of the 2005 NetFlix annual report below. You can navigate through the pages in the report by either clicking on the pages listed below, or by using the keyword search tool below to find specific information within the annual report.-
 1
1 -
2
-
3
-
4
-
5
-
6
-
7
-
8
-
9
-
10
-
11
-
12
-
13
-
14
-
15
-
16
-
17
-
18
-
19
-
20
-
21
-
22
-
23
-
24
-
25
-
26
-
27
-
28
-
29
-
30
-
31
-
32
-
33
-
34
-
35
-
36
-
37
-
38
-
39
-
40
-
41
-
42
-
43
-
44
-
45
-
46
-
47
-
48
-
49
-
50
-
51
-
52
-
53
-
54
-
55
-
56
-
57
-
58
-
59
-
 60
60 -
 61
61 -
 62
62 -
 63
63 -
 64
64 -
 65
65 -
 66
66 -
 67
67 -
 68
68 -
 69
69 -
 70
70 -
 71
71 -
 72
72 -
 73
73 -
 74
74 -
 75
75 -
 76
76 -
 77
77 -
 78
78 -
 79
79 -
 80
80 -
81
-
82
-
83
-
84
-
85
-
86
-
87
-
88
-
89
-
90
-
91
-
92
-
93
-
94
-
95
-
96
 |
 |

NETFLIX, INC.
NOTES TO CONSOLIDATED FINANCIAL STATEMENTS—(Continued)
(in thousands, except share and per share data and percentages)
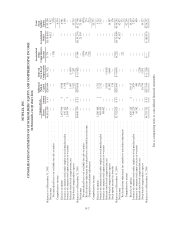
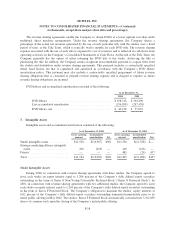
profit and Operating expenses in the Consolidated Statements of Income for 2003 and 2004 have been
reclassified to conform to the 2005 presentation.
The reclassifications did not impact operating income or net income, working capital or net cash provided
by operating activities as previously reported. The following amounts were reclassified for 2003 and 2004:
Year ended December 31, 2003 Year ended December 31, 2004
Consolidated Statements of Income
As previously
reported Reclassifications
As
Reclassified
As previously
reported Reclassifications
As
Reclassified
Revenues:
Subscription ................ $270,410 $ — $270,410 $500,611 $ — $500,611
Sales ...................... 1,833 (1,833) — 5,617 (5,617) —
Total revenues .......... 272,243 (1,833) 270,410 506,228 (5,617) 500,611
Cost of revenues: —
Subscription ................ 147,736 — 147,736 273,401 — 273,401
Sales ...................... 624 (624) — 3,057 (3,057) —
Fulfillment expenses ......... — 31,274 31,274 — 56,609 56,609
Total cost of revenues .... 148,360 30,650 179,010 276,458 53,552 330,010
Gross profit ..................... 123,883 (32,483) 91,400 229,770 (59,169) 170,601
Operating expenses:
Fulfillment ................. 31,274 (31,274) — 56,609 (56,609) —
Technology and development . . 17,884 — 17,884 22,906 — 22,906
Marketing .................. 49,949 — 49,949 98,027 — 98,027
General and administrative .... 9,585 — 9,585 16,287 — 16,287
Stock-based compensation ..... 10,719 — 10,719 16,587 — 16,587
Gain on disposal of DVDs ..... — (1,209) (1,209) — (2,560) (2,560)
Total operating expenses . . 119,411 (32,483) 86,928 210,416 (59,169) 151,247
Operating income ................ 4,472 — 4,472 19,354 — 19,354
Other income (expense):
Interest and other income ...... 2,457 — 2,457 2,592 — 2,592
Interest and other expense. ..... (417) — (417) (170) — (170)
Income before income taxes ....... 6,512 — 6,512 21,776 — 21,776
Provision for (benefit from) income
taxes ........................ — — — 181 — 181
Net income ..................... $ 6,512 $ — $ 6,512 $ 21,595 $ — $ 21,595
Stock Split
On January 16, 2004, the Company’s Board of Directors approved a two-for-one stock split in the form of a
stock dividend on all outstanding shares of the Company’s common stock. As a result of the stock split, the
Company’s stockholders received one additional share for each share of common stock held on the record date of
February 2, 2004. The additional shares of common stock were distributed on February 11, 2004. All common
share and per-share amounts in the accompanying consolidated financial statements and related notes have been
retroactively adjusted to reflect the stock split for all years presented.
Fair Value of Financial Instruments
The fair value of the Company’s cash, short-term investments, accounts payable, accrued expenses and
capital lease obligations approximates their carrying value due to their short maturity.
F-10