NetFlix 2005 Annual Report Download - page 51
Download and view the complete annual report
Please find page 51 of the 2005 NetFlix annual report below. You can navigate through the pages in the report by either clicking on the pages listed below, or by using the keyword search tool below to find specific information within the annual report.-
 1
1 -
2
-
3
-
4
-
5
-
6
-
7
-
8
-
9
-
10
-
11
-
12
-
13
-
14
-
15
-
16
-
17
-
18
-
19
-
20
-
21
-
22
-
23
-
24
-
25
-
26
-
27
-
28
-
29
-
30
-
31
-
32
-
33
-
34
-
35
-
36
-
37
-
38
-
39
-
40
-
 41
41 -
 42
42 -
 43
43 -
 44
44 -
 45
45 -
 46
46 -
 47
47 -
 48
48 -
 49
49 -
 50
50 -
 51
51 -
 52
52 -
 53
53 -
 54
54 -
 55
55 -
 56
56 -
 57
57 -
 58
58 -
 59
59 -
 60
60 -
 61
61 -
62
-
63
-
64
-
65
-
66
-
67
-
68
-
69
-
70
-
71
-
72
-
73
-
74
-
75
-
76
-
77
-
78
-
79
-
80
-
81
-
82
-
83
-
84
-
85
-
86
-
87
-
88
-
89
-
90
-
91
-
92
-
93
-
94
-
95
-
96
 |
 |

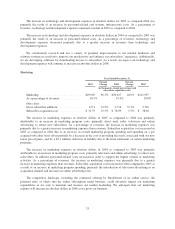
the fair value of the stock options granted beginning in the second quarter of 2005. However, the impact of this
decrease was partially offset by an increase in the expected life assumption used to estimate the fair value of the
stock options granted beginning in the second quarter of 2005 and higher expense resulting from larger grants
and higher average grant prices.
The increase in stock-based compensation expenses in absolute dollars in 2004 as compared to 2003 was
primarily due to higher expenses resulting from larger grants, higher average grant prices and higher volatility
assumptions in 2004 as compared to 2003.
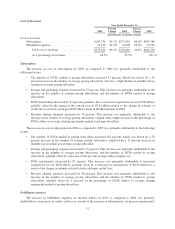
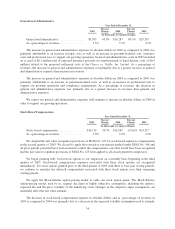
Gain on disposal of DVDs
Year Ended December 31,
2003
Percent
Change 2004
Percent
Change 2005
(in thousands, except percentages)
Gain on disposal of DVDs ................. $(1,209) 111.7% $(2,560) (22.4)% $(1,987)
As a percentage of revenues ................ (0.4)% (0.5)% (0.3)%
In prior periods, proceeds from sales of previously viewed DVDs and the related cost of DVDs sold were
reported as Sales revenues and Cost of sales revenues, respectively, on our Consolidated Statements of Income.
In 2005, in light of discussions with the SEC and consistent with the guidance in SFAS 95 and SFAS 144, we
began to report the net gain on sales of DVDs as a separate line item within operating expenses. Accordingly,
Sales revenues and Cost of sales revenues in the Consolidated Statements of Income for 2003 and 2004 were
reclassified to conform to the 2005 presentation (see Note 1 of Notes to Consolidated Financial Statements).
The decrease in gain on disposal of DVDs in absolute dollars in 2005 as compared to 2004 was primarily
attributable to an increase in the cost of DVD sales.
The increase in gain on disposal of DVDs in absolute dollars in 2004 as compared to 2003 was primarily
attributable to an increase in volume of DVDs sold, offset in part by an increase in cost of DVD sales.
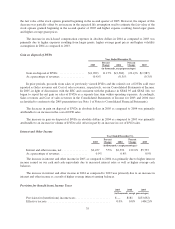
Interest and Other Income
Year Ended December 31,
2003
Percent
Change 2004
Percent
Change 2005
(in thousands, except percentages)
Interest and other income, net ................. $2,457 5.5% $2,592 122.0% $5,753
As a percentage of revenues .................. 0.9% 0.4% 0.9%
The increase in interest and other income in 2005 as compared to 2004 was primarily due to higher interest
income earned on our cash and cash equivalents due to increased interest rates as well as higher average cash
balances.
The increase in interest and other income in 2004 as compared to 2003 was primarily due to an increase in
interest and other income as a result of higher average interest earning balances.
Provision for (benefit from) Income Taxes
2003 2004 2005
(in thousands, except percentages)
Provision for (benefit from) income taxes ....................... $— $181 $(33,692)
Effective tax rate .......................................... 0.0% 0.8% (404.2)%
35