NetFlix 2005 Annual Report Download - page 66
Download and view the complete annual report
Please find page 66 of the 2005 NetFlix annual report below. You can navigate through the pages in the report by either clicking on the pages listed below, or by using the keyword search tool below to find specific information within the annual report.-
 1
1 -
2
-
3
-
4
-
5
-
6
-
7
-
8
-
9
-
10
-
11
-
12
-
13
-
14
-
15
-
16
-
17
-
18
-
19
-
20
-
21
-
22
-
23
-
24
-
25
-
26
-
27
-
28
-
29
-
30
-
31
-
32
-
33
-
34
-
35
-
36
-
37
-
38
-
39
-
40
-
41
-
42
-
43
-
44
-
45
-
46
-
47
-
48
-
49
-
50
-
51
-
52
-
53
-
54
-
55
-
 56
56 -
 57
57 -
 58
58 -
 59
59 -
 60
60 -
 61
61 -
 62
62 -
 63
63 -
 64
64 -
 65
65 -
 66
66 -
 67
67 -
 68
68 -
 69
69 -
 70
70 -
 71
71 -
 72
72 -
 73
73 -
 74
74 -
 75
75 -
 76
76 -
77
-
78
-
79
-
80
-
81
-
82
-
83
-
84
-
85
-
86
-
87
-
88
-
89
-
90
-
91
-
92
-
93
-
94
-
95
-
96
 |
 |

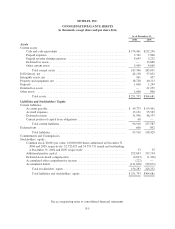
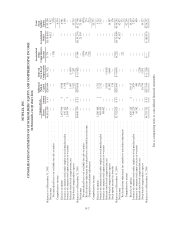
NETFLIX, INC.
CONSOLIDATED STATEMENTS OF INCOME
(in thousands, except per share data)
Year ended December 31,
2003 2004 2005
Revenues ...................................................... $270,410 $500,611 $682,213
Cost of revenues:
Subscription ................................................ 147,736 273,401 393,788
Fulfillment expenses* ........................................ 31,274 56,609 70,762
Total cost of revenues. .................................... 179,010 330,010 464,550
Gross profit ..................................................... 91,400 170,601 217,663
Operating expenses:
Technology and development* ................................. 17,884 22,906 30,942
Marketing* ................................................. 49,949 98,027 141,997
General and administrative* ................................... 9,585 16,287 29,395
Stock-based compensation ..................................... 10,719 16,587 14,327
Gain on disposal of DVDs ..................................... (1,209) (2,560) (1,987)
Total operating expenses .................................. 86,928 151,247 214,674
Operating income ................................................ 4,472 19,354 2,989
Other income (expense):
Interest and other income ...................................... 2,457 2,592 5,753
Interest and other expense ..................................... (417) (170) (407)
Income before income taxes ........................................ 6,512 21,776 8,335
Provision for (benefit from) income taxes ............................. — 181 (33,692)
Net income ..................................................... $ 6,512 $ 21,595 $ 42,027
Net income per share:
Basic ...................................................... $ 0.14 $ 0.42 $ 0.79
Diluted .................................................... $ 0.10 $ 0.33 $ 0.64
Weighted-average common shares outstanding:
Basic ...................................................... 47,786 51,988 53,528
Diluted .................................................... 62,884 64,713 65,518
* Amortization of stock-based compensation not included in expense line
items:
Fulfillment ................................................. $ 1,349 $ 1,702 $ 1,225
Technology and development .................................. 3,979 6,561 4,446
Marketing .................................................. 1,586 2,507 2,565
General and administrative .................................... 3,805 5,817 6,091
Total operating expenses ...................................... $ 10,719 $ 16,587 $ 14,327
See accompanying notes to consolidated financial statements.
F-6