NetFlix 2005 Annual Report Download - page 46
Download and view the complete annual report
Please find page 46 of the 2005 NetFlix annual report below. You can navigate through the pages in the report by either clicking on the pages listed below, or by using the keyword search tool below to find specific information within the annual report.-
 1
1 -
2
-
3
-
4
-
5
-
6
-
7
-
8
-
9
-
10
-
11
-
12
-
13
-
14
-
15
-
16
-
17
-
18
-
19
-
20
-
21
-
22
-
23
-
24
-
25
-
26
-
27
-
28
-
29
-
30
-
31
-
32
-
33
-
34
-
35
-
 36
36 -
 37
37 -
 38
38 -
 39
39 -
 40
40 -
 41
41 -
 42
42 -
 43
43 -
 44
44 -
 45
45 -
 46
46 -
 47
47 -
 48
48 -
 49
49 -
 50
50 -
 51
51 -
 52
52 -
 53
53 -
 54
54 -
 55
55 -
 56
56 -
57
-
58
-
59
-
60
-
61
-
62
-
63
-
64
-
65
-
66
-
67
-
68
-
69
-
70
-
71
-
72
-
73
-
74
-
75
-
76
-
77
-
78
-
79
-
80
-
81
-
82
-
83
-
84
-
85
-
86
-
87
-
88
-
89
-
90
-
91
-
92
-
93
-
94
-
95
-
96
 |
 |

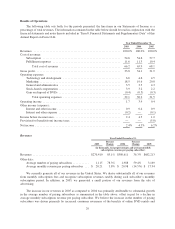
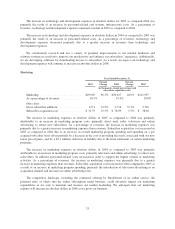
continuing improvements in our service. The decline in the average monthly subscription revenue per paying
subscriber was a result of the price decrease of our most popular subscription plan coupled with the increased
promotion of our lower cost subscription plans. In June 2004, we increased the monthly subscription price of our
most popular subscription plan from $19.95 to $21.99. However, effective November 2004, we lowered the price
of the most popular subscription plan to $17.99. In addition, we introduced new lower priced subscription plans
in the second quarter of 2005. We expect the average revenue per paying subscriber to continue to decline as we
promote our lower priced subscription plans.
The increase in our revenues in 2004 as compared to 2003 was primarily as a result of substantial growth in
the average number of paying subscribers and to a lesser extent, due to a slight increase in average monthly
subscription revenue per paying subscriber. We believe the increase in the number of paying subscribers was
driven by the continuing consumer adoption of DVD players, increased consumer awareness of our service and
continuing improvements in our service. The increase in the average monthly subscription revenue per paying
subscriber was a result of the price increases discussed above.
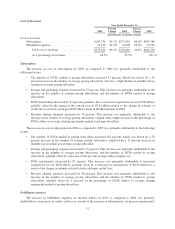
Churn declined to 4.0 percent in the fourth quarter of 2005 from 4.4 percent in the same period of 2004 and
from 4.8 percent in the same period of 2003. We believe the decline was primarily due to the following factors:
• The impact of pricing and the introduction of lower cost subscription plans. The reduction in the price of
our most popular subscription plan from $21.99 per month to $17.99 per month effective November 1,
2004 caused a decline in churn. Prior to that, in June 2004, we experienced an increase in churn when
we increased the price of our standard subscription plan from $19.95 per month to $21.99 per month.
Additionally, the introduction of lower cost subscription plans also contributed to the decline in churn.
• Aging subscriber base. As we grow, the ratio of new subscribers to total subscribers declines, leading to
an increase in the average duration, or age, of the subscriber base. New subscribers are actually more
likely to cancel their subscriptions than older subscribers, and therefore, an increase in subscriber age
helps overall reductions in churn.
• Service improvements. We continued to make improvements in a number of key areas, including
increasing the selection of titles as we expanded our DVD library and enhancing our Web site and
recommendation service. We believe these improvements to our service increased subscriber
satisfaction, which resulted in lower churn.
If we are unable to compete effectively against Blockbuster and our other existing competitors as well as
against potential new entrants into the online movie rental subscription business, in both retaining our existing
subscribers and attracting new subscribers, our churn will likely increase and our business will be adversely
affected.
The following table presents our ending subscriber information:
As of December 31,
2003
Percent
Change 2004
Percent
Change 2005
(in thousands, except percentages)
Free subscribers ................................ 71 124 153
As a percentage of total subscribers ............... 4.8% 4.8% 3.7%
Paid subscribers ................................ 1,416 2,486 4,026
As a percentage of total subscribers ............... 95.2% 95.2% 96.3%
Total Subscribers ........................... 1,487 75.5% 2,610 60.1% 4,179
30