NetFlix 2005 Annual Report Download - page 52
Download and view the complete annual report
Please find page 52 of the 2005 NetFlix annual report below. You can navigate through the pages in the report by either clicking on the pages listed below, or by using the keyword search tool below to find specific information within the annual report.-
 1
1 -
2
-
3
-
4
-
5
-
6
-
7
-
8
-
9
-
10
-
11
-
12
-
13
-
14
-
15
-
16
-
17
-
18
-
19
-
20
-
21
-
22
-
23
-
24
-
25
-
26
-
27
-
28
-
29
-
30
-
31
-
32
-
33
-
34
-
35
-
36
-
37
-
38
-
39
-
40
-
41
-
 42
42 -
 43
43 -
 44
44 -
 45
45 -
 46
46 -
 47
47 -
 48
48 -
 49
49 -
 50
50 -
 51
51 -
 52
52 -
 53
53 -
 54
54 -
 55
55 -
 56
56 -
 57
57 -
 58
58 -
 59
59 -
 60
60 -
 61
61 -
 62
62 -
63
-
64
-
65
-
66
-
67
-
68
-
69
-
70
-
71
-
72
-
73
-
74
-
75
-
76
-
77
-
78
-
79
-
80
-
81
-
82
-
83
-
84
-
85
-
86
-
87
-
88
-
89
-
90
-
91
-
92
-
93
-
94
-
95
-
96
 |
 |

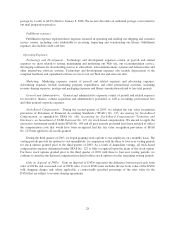
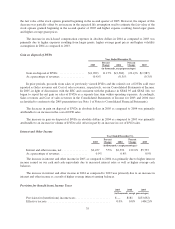
In 2005, we recorded an income tax benefit of $33.7 million on pretax income of $8.3 million. Our 2005
income tax benefit includes a tax benefit for the reduction in the valuation allowance of $34.9 million. We
continuously monitor the circumstances impacting the expected realization of our deferred tax assets. In the
fourth quarter of 2005 we reduced the valuation allowance after determining that substantially all deferred tax
assets are more likely than not to be realizable due to expected future income. In 2004, we recorded an income
tax provision of $0.2 million on a pre-tax income of $21.8 million. Our effective tax rates for all years differ
from the federal statutory rate of 35% primarily due to the valuation allowance in all years.
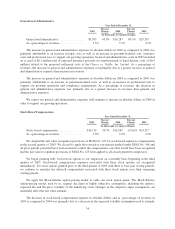
We currently anticipate that our effective tax rate will be approximately 41% in 2006. The effective rate will
be impacted, favorably or unfavorably, by the effect of book and tax stock option expenses in 2006.
Liquidity and Capital Resources
Since inception, we have financed our activities primarily through a series of private placements of
convertible preferred stock, subordinated promissory notes, our initial public offering and net cash generated
from operating activities. As of December 31, 2005, we had cash and cash equivalents of $212.3 million. We
have generated net cash from operations during each quarter since the second quarter of 2001. Many factors will
impact our ability to continue to generate and grow cash from our operations including, but not limited to, the
number of subscribers who sign up for our service, the growth or reduction in our subscriber base, and our ability
to develop new revenue sources. In addition, we may have to or otherwise choose to lower our prices and
increase our marketing expenses in order to grow faster or respond to competition. Although we currently
anticipate that cash flows from operations, together with our available funds, will be sufficient to meet our cash
needs for the foreseeable future, we may require or choose to obtain additional financing. Our ability to obtain
financing will depend on, among other things, our development efforts, business plans, operating performance
and the condition of the capital markets at the time we seek financing. If we raise additional funds through the
issuance of equity, equity-linked or debt securities, those securities may have rights, preferences or privileges
senior to the rights of our common stock, and our stockholders may experience dilution.
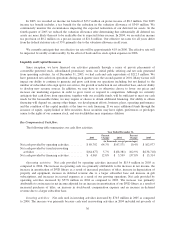
Key Components of Cash flow:
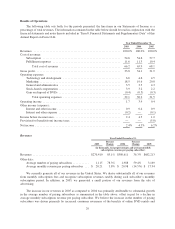
The following table summarizes our cash flow activities:
Year Ended December 31,
2003
Percent
Change 2004
Percent
Change 2005
(in thousands, except percentages)
Net cash provided by operating activities ......... $89,792 64.3% $147,571 10.4% $ 162,977
Net cash provided by (used in) investing
activities ................................ $(64,677) 5.7% $ (68,381) 102.9% $(138,718)
Net cash provided by financing activities ......... $ 4,965 12.8% $ 5,599 137.8% $ 13,314
Operating activities: Net cash provided by operating activities increased by $15.4 million in 2005 as
compared to 2004. The increase in operating cash was primarily attributable to the increase in net income, the
increase in amortization of DVD library as a result of increased purchases of titles, increase in depreciation of
property and equipment, increase in deferred revenue due to a larger subscriber base and increase in gift
subscriptions, and increases in accrued expenses as a result of our growing operations. Net cash provided by
operating activities increased by $57.8 million in 2004 as compared to 2003. The increase was primarily
attributable to an increase in net income adjusted for an increase in amortization of our DVD library as a result of
increased purchases of titles, an increase in stock-based compensation expense and an increase in deferred
revenue due to a larger subscriber base.
Investing activities: Net cash used in investing activities increased by $70.3 million in 2005 as compared
to 2004. The increase was primarily because cash used in investing activities in 2004 included net proceeds of
36