NetFlix 2005 Annual Report Download - page 39
Download and view the complete annual report
Please find page 39 of the 2005 NetFlix annual report below. You can navigate through the pages in the report by either clicking on the pages listed below, or by using the keyword search tool below to find specific information within the annual report.-
 1
1 -
2
-
3
-
4
-
5
-
6
-
7
-
8
-
9
-
10
-
11
-
12
-
13
-
14
-
15
-
16
-
17
-
18
-
19
-
20
-
21
-
22
-
23
-
24
-
25
-
26
-
27
-
28
-
 29
29 -
 30
30 -
 31
31 -
 32
32 -
 33
33 -
 34
34 -
 35
35 -
 36
36 -
 37
37 -
 38
38 -
 39
39 -
 40
40 -
 41
41 -
 42
42 -
 43
43 -
 44
44 -
 45
45 -
 46
46 -
 47
47 -
 48
48 -
 49
49 -
50
-
51
-
52
-
53
-
54
-
55
-
56
-
57
-
58
-
59
-
60
-
61
-
62
-
63
-
64
-
65
-
66
-
67
-
68
-
69
-
70
-
71
-
72
-
73
-
74
-
75
-
76
-
77
-
78
-
79
-
80
-
81
-
82
-
83
-
84
-
85
-
86
-
87
-
88
-
89
-
90
-
91
-
92
-
93
-
94
-
95
-
96
 |
 |

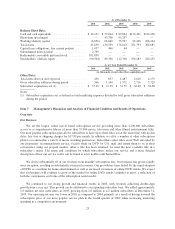
As of December 31,
2001 2002 2003 2004 2005
(in thousands)
Balance Sheet Data:
Cash and cash equivalents ...................... $ 16,131 $ 59,814 $ 89,894 $174,461 $212,256
Short-term investments ........................ — 43,796 45,297 — —
Working (deficit) capital ....................... (6,656) 66,649 75,927 92,436 106,104
Total assets .................................. 41,630 130,530 176,012 251,793 364,681
Capital lease obligations, less current portion ....... 1,057 460 44 — —
Subordinated notes payable ..................... 2,799 ————
Redeemable convertible preferred stock ........... 101,830 ————
Stockholders’ (deficit) equity .................... (90,504) 89,356 112,708 156,283 226,252
As of / Year Ended December 31,
2001 2002 2003 2004 2005
(in thousands, except subscriber acquisition cost)
Other Data:
Total subscribers at end of period ................ 456 857 1,487 2,610 4,179
Gross subscriber additions during period ........... 566 1,140 1,571 2,716 3,729
Subscriber acquisition cost (1) ................... $ 37.16 $ 31.39 $ 31.79 $ 36.09 $ 38.08
Notes:
(1) Subscriber acquisition cost is defined as total marketing expenses divided by total gross subscriber additions
during the period.
Item 7. Management’s Discussion and Analysis of Financial Condition and Results of Operations
Overview
Our Business
We are the largest online movie rental subscription service providing more than 4,200,000 subscribers
access to a comprehensive library of more than 55,000 movie, television and other filmed entertainment titles.
Our most popular subscription plan allows subscribers to have up to three titles out at the same time with no due
dates, late fees or shipping charges for $17.99 per month. In addition, we offer a number of other subscription
plans to accommodate a variety of movie watching preferences. Subscribers select titles at our Web site aided by
our proprietary recommendation service, receive them on DVD by U.S. mail and return them to us at their
convenience using our prepaid mailers. After a title has been returned, we mail the next available title in a
subscriber’s queue. The terms and conditions by which subscribers utilize our service and a more detailed
description of how our service works can be found at www.netflix.com/TermsOfUse.
We derive substantially all of our revenues from monthly subscription fees. Our business has grown rapidly
since inception, resulting in substantially increased revenues. Our growth has been fueled by the rapid adoption
of DVDs as a medium for home entertainment as well as increased awareness of online DVD rentals. We expect
that our business will continue to grow as the market for online DVD rentals continues to grow, a reflection of
both the convenience and value of the subscription rental model.
We continued to see strong growth and financial results in 2005, with revenues achieving double-digit
growth from a year ago. This growth can be attributed to an expanding subscriber base. We added approximately
1.6 million net new subscribers in 2005, growing from 2.6 million to 4.2 million subscribers at December 31,
2005. Our operating income was lower in 2005 as compared to 2004 primarily as a result of having lowered the
subscription price of our most popular service plan in the fourth quarter of 2004 while increasing marketing
spending in a competitive environment.
23