National Grid 2015 Annual Report Download - page 95
Download and view the complete annual report
Please find page 95 of the 2015 National Grid annual report below. You can navigate through the pages in the report by either clicking on the pages listed below, or by using the keyword search tool below to find specific information within the annual report.-
 1
1 -
2
-
3
-
4
-
5
-
6
-
7
-
8
-
9
-
10
-
11
-
12
-
13
-
14
-
15
-
16
-
17
-
18
-
19
-
20
-
21
-
22
-
23
-
24
-
25
-
26
-
27
-
28
-
29
-
30
-
31
-
32
-
33
-
34
-
35
-
36
-
37
-
38
-
39
-
40
-
41
-
42
-
43
-
44
-
45
-
46
-
47
-
48
-
49
-
50
-
51
-
52
-
53
-
54
-
55
-
56
-
57
-
58
-
59
-
60
-
61
-
62
-
63
-
64
-
65
-
66
-
67
-
68
-
69
-
70
-
71
-
72
-
73
-
74
-
75
-
76
-
77
-
78
-
79
-
80
-
81
-
82
-
83
-
84
-
 85
85 -
 86
86 -
 87
87 -
 88
88 -
 89
89 -
 90
90 -
 91
91 -
 92
92 -
 93
93 -
 94
94 -
 95
95 -
 96
96 -
 97
97 -
 98
98 -
 99
99 -
 100
100 -
 101
101 -
 102
102 -
 103
103 -
 104
104 -
 105
105 -
106
-
107
-
108
-
109
-
110
-
111
-
112
-
113
-
114
-
115
-
116
-
117
-
118
-
119
-
120
-
121
-
122
-
123
-
124
-
125
-
126
-
127
-
128
-
129
-
130
-
131
-
132
-
133
-
134
-
135
-
136
-
137
-
138
-
139
-
140
-
141
-
142
-
143
-
144
-
145
-
146
-
147
-
148
-
149
-
150
-
151
-
152
-
153
-
154
-
155
-
156
-
157
-
158
-
159
-
160
-
161
-
162
-
163
-
164
-
165
-
166
-
167
-
168
-
169
-
170
-
171
-
172
-
173
-
174
-
175
-
176
-
177
-
178
-
179
-
180
-
181
-
182
-
183
-
184
-
185
-
186
-
187
-
188
-
189
-
190
-
191
-
192
-
193
-
194
-
195
-
196
-
197
-
198
-
199
-
200
 |
 |

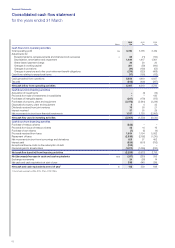
Unaudited commentary on the consolidated cash flow statement
The consolidated cash flow statement shows how the cash
balance has moved during the year. Cash inflows and outflows
are presented to allow users to understand how they relate to
the day-to-day operations of the business (Operating activities);
the money that has been spent or earned on assets in the
year,including acquisitions of physical assets or other
businesses (Investing activities); and the cash raised from
debtor share issues and other loan borrowings or repayments
(Financing activities).
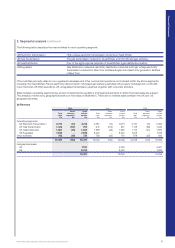
Reconciliation of cash flow to net debt
2015
£m
2014
£m
Cash generated from operations 5,350 4,419
Net capital expenditure (3,274) (3,119)
Business net cash flow 2,076 1,300
Net interest paid (including exceptional interest) (941) (866)
Tax paid (343) (400)
Net acquisitions and disposals –(4)
Dividends paid (1,271) (1,059)
Other cash movements (243) 47
Non-cash movements (2,003) 1,221
(Increase)/decrease in net debt (2,725) 239
Opening net debt (21,190) (21,429)
Closing net debt (23,915) (21,19 0)
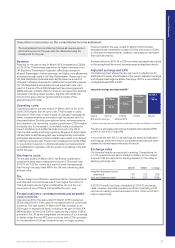
Cash generated from operations
4,854 4,487
2011/12
201
0/11 2012/13 2013/14 2014/15
4,037 4,419
5,350
Cash generated from operations
£m
Cash flows from our operations are largely stable when viewed
over the longer term. Our electricity and gas transmission and
distribution operations in the UK are subject to multi-year rate
agreements with regulators. In the UK, we have largely stable
inter-year cash flows. However, in the US our short-term cash
flows are dependent on the price of gas and electricity and the
timing of customer payments. The regulatory mechanisms for
recovering costs from customers can result in significant cash
flowswings from year to year. Changes in volumes in the US,
forexample as a consequence of abnormally mild or extreme
weathercan affect cash flows, particularly in the winter months.
For the year ended 31 March 2015, cash flow from operations
increased by £931m to £5,350m.
Changes in working capital improved by £360m over the prior
year, principally in the US (£441m) due to the collection of high
winter 2014 billings and other settlements including Hurricane
Sandy re-insurance claims and LIPA receipts. Cash outflows
relating to exceptional items were £133m lower, as the prior year
included reorganisation costs in the UK and LIPA MSA transition
costs in the US.
Net capital expenditure
Net capital expenditure in the year of £3,274m was £155m higher
than the prior year. This was a result of higher spend in our
USregulated businesses, reflecting a record year of investment,
partially offset by lower spend in our UKregulated businesses.
Net interest paid
Net interest paid and exceptional finance costs in 2014/15 were
£941m, £75m higher than 2013/14 due to £152m debt redemption
cash outflows.
Tax paid
Tax paid in the year to 31 March 2015 was £343m, £57m lower
than prior year. This reflected repayments received in the US
during the period.
Dividends paid
Dividends paid in the year ended 31 March 2015 amounted to
£1,271m. This was £212m higher than 2013/14, reflecting the
increase in the final dividend for the year ended 31 March 2014
paid in August 2014, together with a lower average scrip dividend
take-up in the year.
Other cash movements
Other cash flows principally arise from dividends from joint
ventures and movements in treasury shares, including the cost
ofrepurchasing shares as part of the share buyback programme
(£338m).
Non-cash movements
The non-cash movements are predominantly due to the
strengthening of the US dollar against sterling, resulting in
movements in foreign exchange arising on net debt held in
currencies other than sterling. In the year, the dollar strengthened
from $1.67 at 31 March 2014 to $1.49 at 31March 2015.
Other non-cash movements are from changes in fair values of
financial assets and liabilities and interest accretions and accruals.
Net debt
2012
2011
2013 2014 2015
18,731 19,597 21,429
23,915
21,19 0
Net debt at 31 March
£m
Financial Statements
NATIONAL GRID ANNUAL REPORT AND ACCOUNTS 2014/15 93