National Grid 2015 Annual Report Download - page 192
Download and view the complete annual report
Please find page 192 of the 2015 National Grid annual report below. You can navigate through the pages in the report by either clicking on the pages listed below, or by using the keyword search tool below to find specific information within the annual report.-
 1
1 -
2
-
3
-
4
-
5
-
6
-
7
-
8
-
9
-
10
-
11
-
12
-
13
-
14
-
15
-
16
-
17
-
18
-
19
-
20
-
21
-
22
-
23
-
24
-
25
-
26
-
27
-
28
-
29
-
30
-
31
-
32
-
33
-
34
-
35
-
36
-
37
-
38
-
39
-
40
-
41
-
42
-
43
-
44
-
45
-
46
-
47
-
48
-
49
-
50
-
51
-
52
-
53
-
54
-
55
-
56
-
57
-
58
-
59
-
60
-
61
-
62
-
63
-
64
-
65
-
66
-
67
-
68
-
69
-
70
-
71
-
72
-
73
-
74
-
75
-
76
-
77
-
78
-
79
-
80
-
81
-
82
-
83
-
84
-
85
-
86
-
87
-
88
-
89
-
90
-
91
-
92
-
93
-
94
-
95
-
96
-
97
-
98
-
99
-
100
-
101
-
102
-
103
-
104
-
105
-
106
-
107
-
108
-
109
-
110
-
111
-
112
-
113
-
114
-
115
-
116
-
117
-
118
-
119
-
120
-
121
-
122
-
123
-
124
-
125
-
126
-
127
-
128
-
129
-
130
-
131
-
132
-
133
-
134
-
135
-
136
-
137
-
138
-
139
-
140
-
141
-
142
-
143
-
144
-
145
-
146
-
147
-
148
-
149
-
150
-
151
-
152
-
153
-
154
-
155
-
156
-
157
-
158
-
159
-
160
-
161
-
162
-
163
-
164
-
165
-
166
-
167
-
168
-
169
-
170
-
171
-
172
-
173
-
174
-
175
-
176
-
177
-
178
-
179
-
180
-
181
-
 182
182 -
 183
183 -
 184
184 -
 185
185 -
 186
186 -
 187
187 -
 188
188 -
 189
189 -
 190
190 -
 191
191 -
 192
192 -
 193
193 -
 194
194 -
 195
195 -
 196
196 -
 197
197 -
 198
198 -
 199
199 -
 200
200
 |
 |

Additional Information
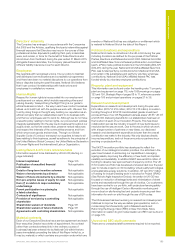
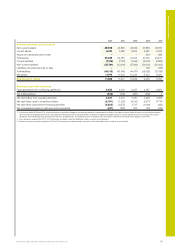
Financial summary (unaudited)
The financial summary set out below has been derived from the audited consolidated financial statements of National Grid for the five
financial years ended 31 March 2015. It should be read in conjunction with the consolidated financial statements and related notes,
together with the Strategic Report. The information presented below for the years ended 31 March 2011, 2012, 2013, 2014 and 2015 has
been prepared under IFRS issued by the IASB and as adopted by the EU1.
2015 2014 201312012120111
Summary income statement
Revenue 15,201 14,809 14,359 13,832 14,343
Operating profit
Before exceptional items, remeasurements and stranded cost recoveries 3,863 3,664 3,639 3,491 3,619
Exceptional items, remeasurements and stranded cost recoveries (83) 71 110 44 145
3,780 3,735 3,749 3,535 3,764
Profit before tax
Before exceptional items, remeasurements and stranded cost recoveries 2,876 2,584 2,533 2,408 2,283
Exceptional items, remeasurements and stranded cost recoveries (248) 164 178 (26) 151
2,628 2,748 2,711 2,382 2,434
Profit for the year 2,011 2,464 2,15 4 1,919 2,043
Profit for the year attributable to equity shareholders
Before exceptional items, remeasurements and stranded cost recoveries 2,189 2,015 1,913 1,709 1,627
Exceptional items, remeasurements and stranded cost recoveries (170) 461 240 208 412
2,019 2,476 2,153 1,917 2,039
Earnings per share
Basic – continuing operations (pence) 2 53.6 65.7 5 7. 2 51.1 56.3
Diluted – continuing operations (pence) 2 53.4 65.4 5 7.0 50.8 56.0
Basic (pence) 2 53.6 65.7 5 7. 2 51.1 56.3
Diluted (pence) 2 53.4 65.4 5 7.0 50.8 56.0
Number of shares – basic (millions) 3 3,766 3,766 3,761 3,755 3,622
Number of shares – diluted (millions) 3 3,783 3,785 3,779 3,774 3,641
Dividends per ordinary share
Paid during the year (pence) 42.25 40.85 39.84 37.40 37.74
Approved or proposed during the year (pence) 42.87 42.03 40.85 39.28 36.37
Paid during the year ($) 0.697 0.636 0.633 0.599 0.592
Approved or proposed during the year ($) 0.672 0.696 0.632 0.623 0.571
Summary consolidated financial information
190