National Grid 2015 Annual Report Download - page 94
Download and view the complete annual report
Please find page 94 of the 2015 National Grid annual report below. You can navigate through the pages in the report by either clicking on the pages listed below, or by using the keyword search tool below to find specific information within the annual report.-
 1
1 -
2
-
3
-
4
-
5
-
6
-
7
-
8
-
9
-
10
-
11
-
12
-
13
-
14
-
15
-
16
-
17
-
18
-
19
-
20
-
21
-
22
-
23
-
24
-
25
-
26
-
27
-
28
-
29
-
30
-
31
-
32
-
33
-
34
-
35
-
36
-
37
-
38
-
39
-
40
-
41
-
42
-
43
-
44
-
45
-
46
-
47
-
48
-
49
-
50
-
51
-
52
-
53
-
54
-
55
-
56
-
57
-
58
-
59
-
60
-
61
-
62
-
63
-
64
-
65
-
66
-
67
-
68
-
69
-
70
-
71
-
72
-
73
-
74
-
75
-
76
-
77
-
78
-
79
-
80
-
81
-
82
-
83
-
 84
84 -
 85
85 -
 86
86 -
 87
87 -
 88
88 -
 89
89 -
 90
90 -
 91
91 -
 92
92 -
 93
93 -
 94
94 -
 95
95 -
 96
96 -
 97
97 -
 98
98 -
 99
99 -
 100
100 -
 101
101 -
 102
102 -
 103
103 -
 104
104 -
105
-
106
-
107
-
108
-
109
-
110
-
111
-
112
-
113
-
114
-
115
-
116
-
117
-
118
-
119
-
120
-
121
-
122
-
123
-
124
-
125
-
126
-
127
-
128
-
129
-
130
-
131
-
132
-
133
-
134
-
135
-
136
-
137
-
138
-
139
-
140
-
141
-
142
-
143
-
144
-
145
-
146
-
147
-
148
-
149
-
150
-
151
-
152
-
153
-
154
-
155
-
156
-
157
-
158
-
159
-
160
-
161
-
162
-
163
-
164
-
165
-
166
-
167
-
168
-
169
-
170
-
171
-
172
-
173
-
174
-
175
-
176
-
177
-
178
-
179
-
180
-
181
-
182
-
183
-
184
-
185
-
186
-
187
-
188
-
189
-
190
-
191
-
192
-
193
-
194
-
195
-
196
-
197
-
198
-
199
-
200
 |
 |

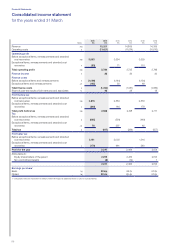
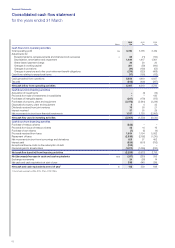
Financial Statements
Notes
2015
£m
2014
£m
2013
£m
Cash flows from operating activities
Total operating profit 2(b) 3,780 3,735 3,749
Adjustments for:
Exceptional items, remeasurements and stranded cost recoveries 483 (71) (110)
Depreciation, amortisation and impairment 1,494 1,417 1,361
Share-based payment charge 20 20 20
Changes in working capital 301 (59) (410)
Changes in provisions (41) (150) (53)
Changes in pensions and other post-retirement benefit obligations (270) (323) (408)
Cash flows relating to exceptional items (17) (150) (112)
Cash generated from operations 5,350 4,419 4,037
Tax paid (343) (400) (287)
Net cash inflow from operating activities 5,007 4,019 3,750
Cash flows from investing activities
Acquisition of investments –(4) (14)
Proceeds from sale of investments in subsidiaries ––183
Purchases of intangible assets (207) (179) (175)
Purchases of property, plant and equipment (3,076) (2,944) (3,214)
Disposals of property, plant and equipment 9432
Dividends received from joint ventures 79 38 21
Interest received 37 35 29
Net movements in short-term financial investments 1,157 1,720 (2,992)
Net cash flow used in investing activities (2,001) (1,330) (6,130)
Cash flows from financing activities
Purchase of treasury shares (338) – –
Proceeds from issue of treasury shares 23 14 19
Purchase of own shares (7) (5) (6)
Proceeds received from loans 1,534 1,134 5,062
Repayment of loans (2,839) (2,192) (1,210)
Net movements in short-term borrowings and derivatives 623 37 452
Interest paid (826) (901) (792)
Exceptional finance costs on the redemption of debt (152) – –
Dividends paid to shareholders (1,271) (1,059) (810)
Net cash flow (used in)/from financing activities (3,253) (2,972) 2,715
Net (decrease)/increase in cash and cash equivalents 26(a) (247) (283) 335
Exchange movements 24 (26) 14
Net cash and cash equivalents at start of year 339 648 299
Net cash and cash equivalents at end of year118 116 339 648
1. Net of bank overdrafts of £3m (2014: £15m; 2013: £23m).
for the years ended 31 March
Consolidated cash flow statement
92