National Grid 2015 Annual Report Download - page 24
Download and view the complete annual report
Please find page 24 of the 2015 National Grid annual report below. You can navigate through the pages in the report by either clicking on the pages listed below, or by using the keyword search tool below to find specific information within the annual report.-
 1
1 -
2
-
3
-
4
-
5
-
6
-
7
-
8
-
9
-
10
-
11
-
12
-
13
-
 14
14 -
 15
15 -
 16
16 -
 17
17 -
 18
18 -
 19
19 -
 20
20 -
 21
21 -
 22
22 -
 23
23 -
 24
24 -
 25
25 -
 26
26 -
 27
27 -
 28
28 -
 29
29 -
 30
30 -
 31
31 -
 32
32 -
 33
33 -
 34
34 -
35
-
36
-
37
-
38
-
39
-
40
-
41
-
42
-
43
-
44
-
45
-
46
-
47
-
48
-
49
-
50
-
51
-
52
-
53
-
54
-
55
-
56
-
57
-
58
-
59
-
60
-
61
-
62
-
63
-
64
-
65
-
66
-
67
-
68
-
69
-
70
-
71
-
72
-
73
-
74
-
75
-
76
-
77
-
78
-
79
-
80
-
81
-
82
-
83
-
84
-
85
-
86
-
87
-
88
-
89
-
90
-
91
-
92
-
93
-
94
-
95
-
96
-
97
-
98
-
99
-
100
-
101
-
102
-
103
-
104
-
105
-
106
-
107
-
108
-
109
-
110
-
111
-
112
-
113
-
114
-
115
-
116
-
117
-
118
-
119
-
120
-
121
-
122
-
123
-
124
-
125
-
126
-
127
-
128
-
129
-
130
-
131
-
132
-
133
-
134
-
135
-
136
-
137
-
138
-
139
-
140
-
141
-
142
-
143
-
144
-
145
-
146
-
147
-
148
-
149
-
150
-
151
-
152
-
153
-
154
-
155
-
156
-
157
-
158
-
159
-
160
-
161
-
162
-
163
-
164
-
165
-
166
-
167
-
168
-
169
-
170
-
171
-
172
-
173
-
174
-
175
-
176
-
177
-
178
-
179
-
180
-
181
-
182
-
183
-
184
-
185
-
186
-
187
-
188
-
189
-
190
-
191
-
192
-
193
-
194
-
195
-
196
-
197
-
198
-
199
-
200
 |
 |
Strategic Report
Financial review continued
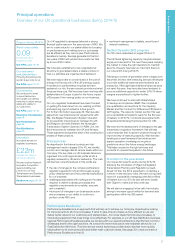
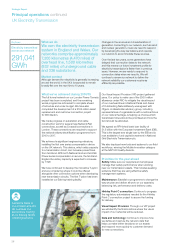
11/12
1
0/11 12/13 13/14 14/15
13.0
13.6 13.6 12.7 13.7
UK return on equity
%
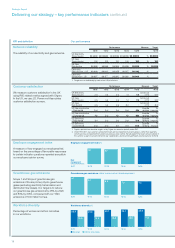
US regulated return on equity
The US RoE has decreased 60bps to 8.4%,
reflecting the additional costs incurred this year as a
result of the severe winter weather and the additional
gas mains leak investigation and repair work required,
together with rate base growth.
2011
2
010 2012 2013 2014
8.8
8.3 9.2 9.0 8.4
US return on equit
y1 %
1. Calculated on a calendar year basis.
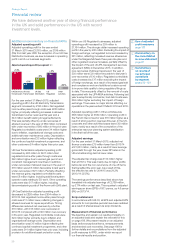
Cash generated from operations
Cash generated from operations was £5,350 million
(2013/14: £4,419 million). Changes in working capital
improved by £360 million over the prior year,
principally in the US (£441 million) due to the
collection of high winter 2014 billings and other
settlements including Superstorm Sandy reinsurance
claims and LIPA receipts. Cash outflows relating to
exceptional items were £133 million lower, as the
prior year included reorganisation costs in the UK
and LIPA MSA transition costs in the US.
Net debt and credit metrics
Our net debt levels will continue to grow for the
nextfew years as we fund our capital investment
programmes and enhance our networks. We continue
to borrow at attractive rates when needed and the
level of net debt remains appropriate for our business.
During 2014/15, net debt has increased by £2.7billion.
This is predominantly due to movements in foreign
exchange rates as the US dollar strengthened
against sterling. Gross borrowings are relatively
consistent year on year, reflecting the current year
net refinancing of maturities and bond repurchases,
while cash and investment levels have been actively
managed down.
With the commencement of the RIIO price controls
in2013 and the slow down in our planned near-term
UK capital investment programme as the industry
assesses the impact of Electricity Market Reform,
wereviewed and restructured the Group debt
portfolio. The review resulted in a £924 million bond
repurchase programme, of which £295 million was
achieved through a cash tender offer for five bonds.
The net repurchase cost of £131 million has been
presented as exceptional finance costs in the
incomestatement, as noted on page 104.
A key measure we use to monitor financial discipline is
retained cash flow divided by adjusted net debt (RCF/
net debt). This is a measure of the operating cash
flows we generate, before capital investment but after
dividends paid to shareholders, compared with the
level of debt we hold. The principal adjustment made
to net debt is to include pension deficits. RCF/net
debt was 11.2% for the year (2013/14: 10.5%;
2012/13: 11.4%). For the current year we have used
this measure to actively manage scrip uptake through
buying back shares when supported by sufficient
headroom. Deducting the cost of buying back these
shares reduces RCF/net debt to 9.9% for the year.
Our long-term target range for RCF/net debt is to
exceed 9.0%, which is consistent with the A3 rating
threshold used by Moody’s, the rating agency.
We additionally monitor interest cover, which is a
measure of the cash flows we generate compared
with the net interest cost of servicing our borrowings.
Interest cover for the year was 5.1 times (2013/14:
4.1times; 2012/13: 3.9 times). Our target long-term
rate for interest cover is in excess of 3 times.
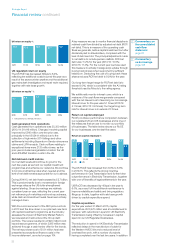
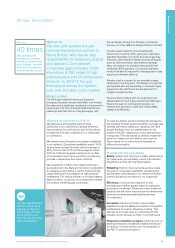
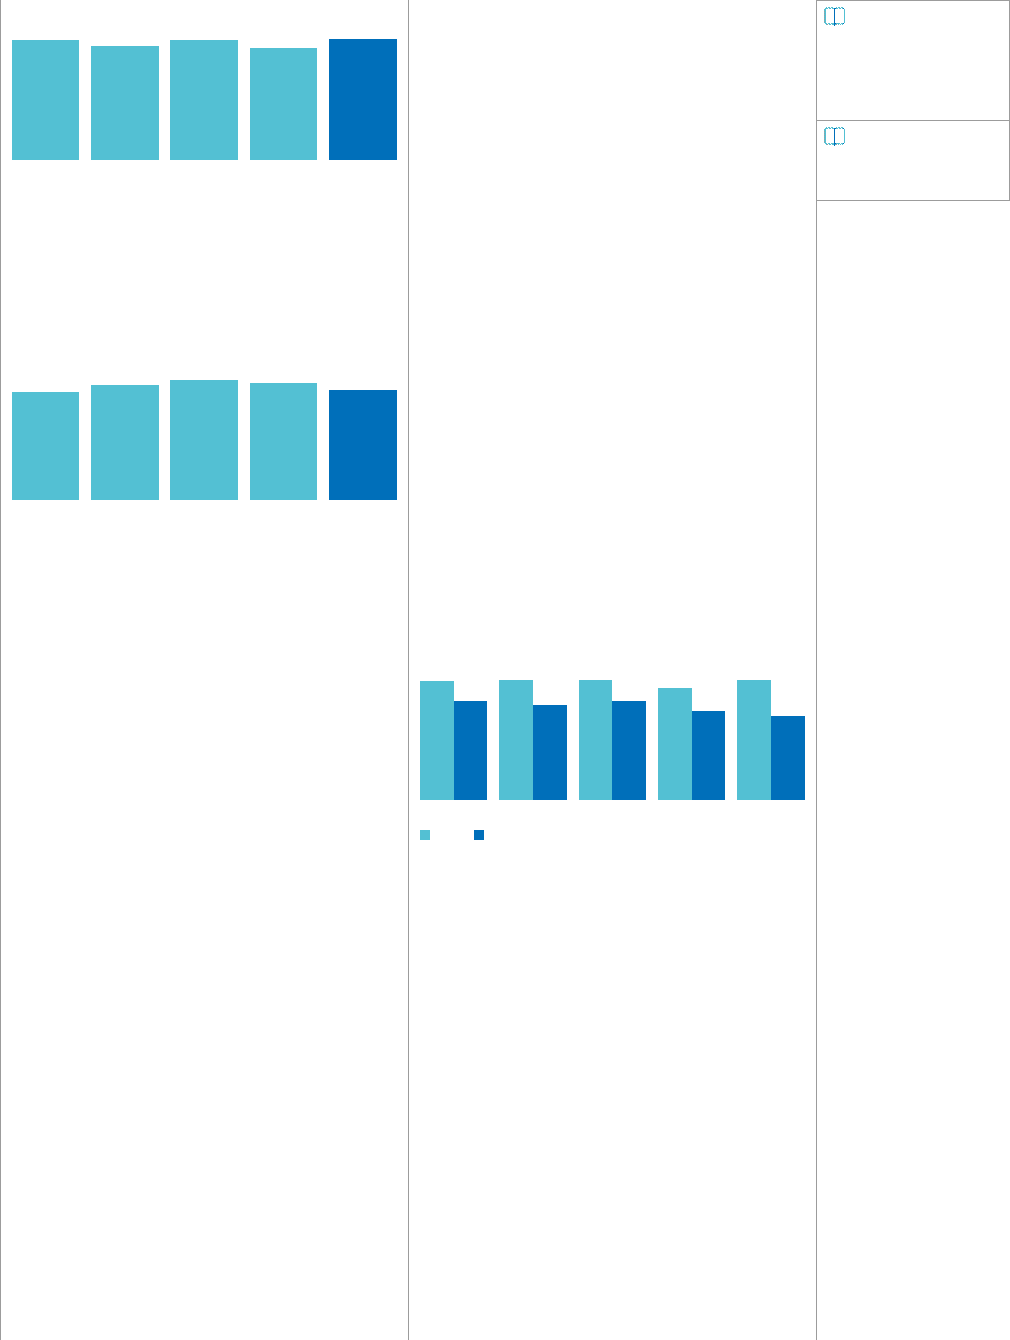
Return on capital employed
RoCE provides a performance comparison between
our regulated UK and US businesses and is one of
the measures that we use to monitor our portfolio
ofbusinesses. The table below shows our RoCE
forour businesses over the last five years:
11/12
1
0/11 12/13 13/14 14/15
8.5
7.1
8.6
6.8
8.6
7.1 8.0
6.4
8.6
6.0
Return on capital employed
%
UK US
The UK RoCE has increased from 8.0% to 8.6%
in2014/15. This reflects the strong incentive
performance in Gas Transmission and further totex
outperformance in Electricity Transmission, together
with one-off benefits of legal settlements in the year.
US RoCE has decreased by 40bps in the year to
6.0%, as a result of the additional maintenance to
improve reliability and safety and bring regulatory
filings up to date, together with rate base growth
driven by capital expenditure spend.
Capital expenditure
For the year ended 31 March 2015, capital
expenditure of £3,470 million was at a similar level to
last year, with reductions in spend in UK Electricity
Transmission being offset by increases in capital
spend in our US Regulated businesses.
The reduction in spend in UK Electricity Transmission
reflected delays in the manufacture of cable for
theWestern HVDC link and a reduced level of
overhead line work, with a number of projects
havingcompleted over the last two years. In addition
Commentary on
the consolidated
cash flow
statement
page 93
Commentary
on borrowings
page 125
22