National Grid 2015 Annual Report Download - page 101
Download and view the complete annual report
Please find page 101 of the 2015 National Grid annual report below. You can navigate through the pages in the report by either clicking on the pages listed below, or by using the keyword search tool below to find specific information within the annual report.-
 1
1 -
2
-
3
-
4
-
5
-
6
-
7
-
8
-
9
-
10
-
11
-
12
-
13
-
14
-
15
-
16
-
17
-
18
-
19
-
20
-
21
-
22
-
23
-
24
-
25
-
26
-
27
-
28
-
29
-
30
-
31
-
32
-
33
-
34
-
35
-
36
-
37
-
38
-
39
-
40
-
41
-
42
-
43
-
44
-
45
-
46
-
47
-
48
-
49
-
50
-
51
-
52
-
53
-
54
-
55
-
56
-
57
-
58
-
59
-
60
-
61
-
62
-
63
-
64
-
65
-
66
-
67
-
68
-
69
-
70
-
71
-
72
-
73
-
74
-
75
-
76
-
77
-
78
-
79
-
80
-
81
-
82
-
83
-
84
-
85
-
86
-
87
-
88
-
89
-
90
-
 91
91 -
 92
92 -
 93
93 -
 94
94 -
 95
95 -
 96
96 -
 97
97 -
 98
98 -
 99
99 -
 100
100 -
 101
101 -
 102
102 -
 103
103 -
 104
104 -
 105
105 -
 106
106 -
 107
107 -
 108
108 -
 109
109 -
 110
110 -
 111
111 -
112
-
113
-
114
-
115
-
116
-
117
-
118
-
119
-
120
-
121
-
122
-
123
-
124
-
125
-
126
-
127
-
128
-
129
-
130
-
131
-
132
-
133
-
134
-
135
-
136
-
137
-
138
-
139
-
140
-
141
-
142
-
143
-
144
-
145
-
146
-
147
-
148
-
149
-
150
-
151
-
152
-
153
-
154
-
155
-
156
-
157
-
158
-
159
-
160
-
161
-
162
-
163
-
164
-
165
-
166
-
167
-
168
-
169
-
170
-
171
-
172
-
173
-
174
-
175
-
176
-
177
-
178
-
179
-
180
-
181
-
182
-
183
-
184
-
185
-
186
-
187
-
188
-
189
-
190
-
191
-
192
-
193
-
194
-
195
-
196
-
197
-
198
-
199
-
200
 |
 |

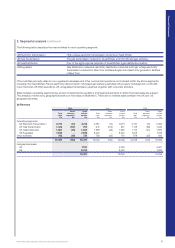
Unaudited commentary on the results of our principal operations by segment
As a business, we have three measures of operating profit that are
used on a regular basis and disclosed in this Annual Report.
Statutory operating profit: This is operating profit as calculated
under International Financial Reporting Standards (IFRS). Statutory
operating profit by segment is shown in note 2 on page 98.
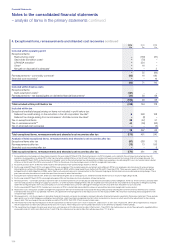
Adjusted operating profit: Adjusted operating profit (business
performance) excludes items that if included could distort
understanding of our performance for the year and the comparability
between periods. Further details of items that are excluded in
adjusted operating profit are shown in note 4 on page 103.
Regulatory financial performance: This is particularly relevant
for our UK operations and is a measure of operating profit that
reflects the impact of the businesses’ regulatory arrangements
when presenting financial performance.
Reconciliations between statutory and adjusted operating profit
can be found on page 186. Reconciliations between adjusted
operating profit and regulatory financial performance for UK
Electricity Transmission, UK Gas Transmission and UK Gas
Distribution can be found on page 100.
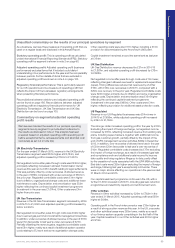
Commentary on segmental adjusted operating
profit results
We have summarised the results of our principal operating
segments here by segment to provide direct reference to
theresults as disclosed in note 2. This analysis has been
prepared based on adjusted operating profit (operating profit
before exceptional items, remeasurements and stranded cost
recoveries) as set out in note 2(b).
UK Electricity Transmission
For the year ended 31 March 2015, revenue in the UK Electricity
Transmission segment was £367m higher at £3,754m, and
adjusted operating profit increased by £150m to £1,237m.
Net regulated income after pass-through costs was £230m higher,
principally reflecting increases in allowed Transmission Owner
revenues this year and a £43m benefit relating to legal settlements.
This was partially offset by under-recoveries of allowed revenue
inthe year of £89m compared with under-recoveries of £60m in
the prior year. Regulated controllable costs were £14m higher
dueto inflation, organisational change costs and additional tower
maintenance costs. Depreciation and amortisation was £33m
higher reflecting the continued capital investment programme
(investment in the year was £1,074m). Other costs were £4m
higher than prior year.
UK Gas Transmission
Revenue in the UK Gas Transmission segment increased by £81m
in 2014/15 to £1,022m and adjusted operating profit increased by
£20m to £437m.
Net regulated income after pass-through costs was £42m higher
due to earned gas permit and constraints management incentives.
In addition, under-recoveries of allowed revenue in the year of £18m
were £3m favourable to last year’s under-recoveries of £21m.
Partially offsetting the revenue gains, regulated controllable costs
were £8m higher, mainly as a result of additional system operator
costs relating to EU work and some organisation change costs.
Other operating costs were also £17m higher, including a £13m
provision for decommissioning the Avonmouth LNG plant.
Capital investment remained around the same level as last year
at£184m.
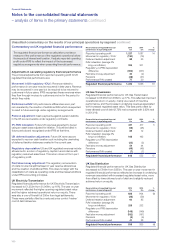
UK Gas Distribution
UK Gas Distribution revenue decreased by £31m in 2014/15
to£1,867m, and adjusted operating profit decreased by £78m
to£826m.
Net regulated income after pass-through costs was £11m lower,
reflecting changes in allowed revenues for replacement expenditure
(repex). Timing differences reduced net revenues by a further
£16m, with£13m over-recoveries in 2014/15, compared with a
£29m over-recovery in the prior year. Regulated controllable costs
were £22m higher primarily due to inflation and some organisation
change costs. Depreciation andamortisation was£15m higher
reflecting the continued capital investment programme
(investment in the year was £498m). Other costs were£14m
higher, reflecting a provision for additional asset protection costs.
US Regulated
Revenue in our US Regulated businesses was £54m lower in
2014/15 at £7,986m, while adjusted operating profit increased
by£39m to£1,164m.
The stronger dollar increased operating profit in the year by £30m.
Excluding the impact of foreign exchange, net regulated income
increased by £81m, reflecting increased revenue from existing rate
plans, including capex trackers, together with additional income
from gas customer growth, partially offset by the impact of the
endof LIPA management services activities (MSA) in December
2013. In addition, over-recoveries of allowed revenues in the year
of £30m were £20m favourable to last year’s over-recoveries of
£10m. Regulated controllable costs increased by £17m excluding
the impact of foreign exchange, as a result of increased gas leak
and compliance work and additional costs incurred to improve
data quality and bring regulatory filings up to date, partly offset
bythe cessation of costs associated with the LIPA MSA activities.
Bad debt costs were £62m higher excluding the impact of foreign
exchange, following last year’s exceptionally cold winter. There
were no major storms affecting our operations in the years ended
31 March 2014 and 2015.
Our capital investment programme continues in the US, with a
further £1,501m invested in 2014/15, including gas leak reduction
programmes and electricity capacity and reinforcement work.
Other activities
Revenue in Other activities increased by £26m to £762m in the
year ended 31 March 2015. Adjusted operating profit was £68m
higher at £199m.
Operating profit in the French interconnector was £18m higher as
aresult of strong auction revenues this year. In the US, corporate
and other activities losses were £63m lower, mainly as a result
ofour finance system upgrade completing in the first half of this
year. Capital investment in our Other activities was £33m higher
at£213m.
Financial Statements
NATIONAL GRID ANNUAL REPORT AND ACCOUNTS 2014/15 99