National Grid 2015 Annual Report Download - page 70
Download and view the complete annual report
Please find page 70 of the 2015 National Grid annual report below. You can navigate through the pages in the report by either clicking on the pages listed below, or by using the keyword search tool below to find specific information within the annual report.-
 1
1 -
2
-
3
-
4
-
5
-
6
-
7
-
8
-
9
-
10
-
11
-
12
-
13
-
14
-
15
-
16
-
17
-
18
-
19
-
20
-
21
-
22
-
23
-
24
-
25
-
26
-
27
-
28
-
29
-
30
-
31
-
32
-
33
-
34
-
35
-
36
-
37
-
38
-
39
-
40
-
41
-
42
-
43
-
44
-
45
-
46
-
47
-
48
-
49
-
50
-
51
-
52
-
53
-
54
-
55
-
56
-
57
-
58
-
59
-
 60
60 -
 61
61 -
 62
62 -
 63
63 -
 64
64 -
 65
65 -
 66
66 -
 67
67 -
 68
68 -
 69
69 -
 70
70 -
 71
71 -
 72
72 -
 73
73 -
 74
74 -
 75
75 -
 76
76 -
 77
77 -
 78
78 -
 79
79 -
 80
80 -
81
-
82
-
83
-
84
-
85
-
86
-
87
-
88
-
89
-
90
-
91
-
92
-
93
-
94
-
95
-
96
-
97
-
98
-
99
-
100
-
101
-
102
-
103
-
104
-
105
-
106
-
107
-
108
-
109
-
110
-
111
-
112
-
113
-
114
-
115
-
116
-
117
-
118
-
119
-
120
-
121
-
122
-
123
-
124
-
125
-
126
-
127
-
128
-
129
-
130
-
131
-
132
-
133
-
134
-
135
-
136
-
137
-
138
-
139
-
140
-
141
-
142
-
143
-
144
-
145
-
146
-
147
-
148
-
149
-
150
-
151
-
152
-
153
-
154
-
155
-
156
-
157
-
158
-
159
-
160
-
161
-
162
-
163
-
164
-
165
-
166
-
167
-
168
-
169
-
170
-
171
-
172
-
173
-
174
-
175
-
176
-
177
-
178
-
179
-
180
-
181
-
182
-
183
-
184
-
185
-
186
-
187
-
188
-
189
-
190
-
191
-
192
-
193
-
194
-
195
-
196
-
197
-
198
-
199
-
200
 |
 |
Corporate Governance
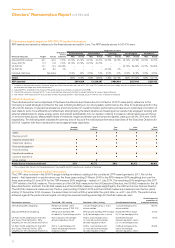
Directors’ Remuneration Report continued
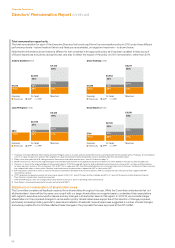
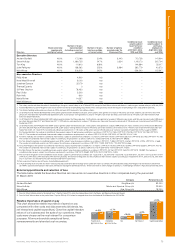
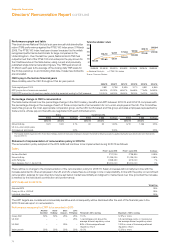
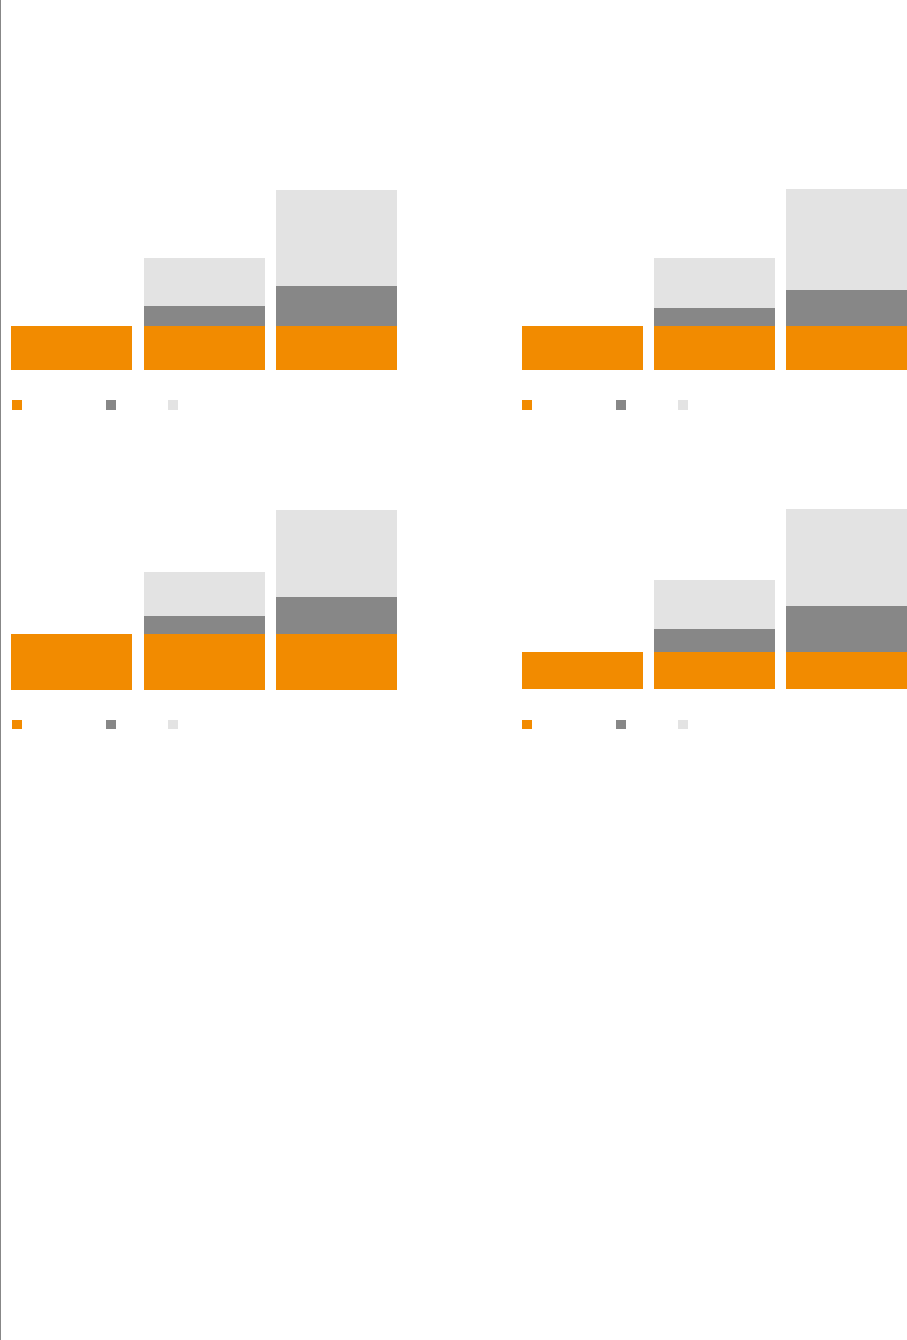
Total remuneration opportunity
The total remuneration for each of the Executive Directors that could result from the remuneration policy in 2015 under three different
performance levels – below threshold (when only fixed pay is receivable), on target and maximum – is shown below.
Note that the information shown below is different to that contained in the approved policy as it has been updated to take account
ofBoard departures and joiners during the year, and also to reflect the impact of the policy on 2015 remuneration, rather than 2014.
100%
43%
18%
39%
53%
£1,015
£2,580
£4,14 5
22%
25%
Fixed pay
On target Maximum
Andrew Bonfield
£’000
Fixed pay APP LTPP
100%
37%
15%
48%
49%
£972
£2,048
£3,125
20%
31%
Fixed pay
On target Maximum
John Pettigrew
£’000
Fixed pay APP LTPP
100%
45%
16%
39%
56%
£1,596
£4,053
£6,511
20%
24%
Fixed pay
On target Maximum
Steve Holliday £’000
Fixed pay APP LTPP
100%
44%
21%
35%
54%
£739
£2,135
£3,531
25%
21%
Fixed pay
On target Maximum
Dean Seavers £’000
Fixed pay APP LTPP
1. ‘Fixed pay’ for Andrew Bonfield, Steve Holliday and John Pettigrew consists of salary, pension and benefits in kind as provided under the remuneration policy. ‘Fixed pay’ for Dean Seavers
consists of salary, the part of his pension that is aligned with salary (see footnote 4 below) and benefits in kind as provided under the remuneration policy.
2. Salary is that to be paid in 2015/16, taking account of the increases that will be effective from 1 June 2015 shown on page 74.
3. Benefits in kind are as shown in the single total figure of remuneration table for 2014/15 on page 69, except for Dean Seavers for whom benefits in kind are assumed to be $37,000.
4. Pension is as shown in the single total figure of remuneration table for 2014/15 on page 69, except for Andrew Bonfield for whom pension is shown as 30% of salary and Dean Seavers,
forwhom pension is shown as 13% of salary plus 13% of APP. This is made up of a 9% Core Plan contribution and a 4% Company match to his 401(k) plan. The element of Dean’s pension
thatis aligned with salary is shown within ‘Fixed pay’ and the element of his pension that isaligned with APP is shown within ‘APP’.
5. APP calculations are based on 125% of salary for the period 1 April 2015 to 31 March 2016. For Dean Seavers, APP also includes the part of his pension that is aligned with APP
(see footnote 4 above).
6. LTPP calculations are based on awards with a face value at grant of 350% of 1 June 2015 salary for Steve Holliday and 300% of 1 June 2015 salary for all other Executive Directors.
They,therefore, exclude future share price movement.
7. LTPP and APP payout is 50% for on target performance and the maximum is 100% for achieving stretch performance.
8. Dean Seaver’s remuneration opportunity has been converted at $1.58:£1.
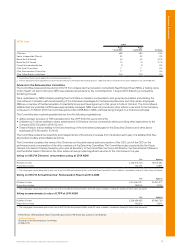
Statement of consideration of shareholder views
The Committee considers all feedback received from shareholders throughout the year. While the Committee understands that not
allshareholders’ views will be the same, we consult with our larger shareholders on a regular basis to understand their expectations
withregard to executive remuneration issues and any changes in shareholder views in this regard. In 2013/14, we consulted larger
shareholders on the proposed changes to remuneration policy. Shareholders were supportive of the direction of change proposed,
particularly increasing holding periods for awards and retention thresholds. Several responses suggested a number of small changes
andwhere possible the Committee reflected these changes in the proposals that were approved at the 2014 AGM.
68