National Grid 2015 Annual Report Download - page 193
Download and view the complete annual report
Please find page 193 of the 2015 National Grid annual report below. You can navigate through the pages in the report by either clicking on the pages listed below, or by using the keyword search tool below to find specific information within the annual report.-
 1
1 -
2
-
3
-
4
-
5
-
6
-
7
-
8
-
9
-
10
-
11
-
12
-
13
-
14
-
15
-
16
-
17
-
18
-
19
-
20
-
21
-
22
-
23
-
24
-
25
-
26
-
27
-
28
-
29
-
30
-
31
-
32
-
33
-
34
-
35
-
36
-
37
-
38
-
39
-
40
-
41
-
42
-
43
-
44
-
45
-
46
-
47
-
48
-
49
-
50
-
51
-
52
-
53
-
54
-
55
-
56
-
57
-
58
-
59
-
60
-
61
-
62
-
63
-
64
-
65
-
66
-
67
-
68
-
69
-
70
-
71
-
72
-
73
-
74
-
75
-
76
-
77
-
78
-
79
-
80
-
81
-
82
-
83
-
84
-
85
-
86
-
87
-
88
-
89
-
90
-
91
-
92
-
93
-
94
-
95
-
96
-
97
-
98
-
99
-
100
-
101
-
102
-
103
-
104
-
105
-
106
-
107
-
108
-
109
-
110
-
111
-
112
-
113
-
114
-
115
-
116
-
117
-
118
-
119
-
120
-
121
-
122
-
123
-
124
-
125
-
126
-
127
-
128
-
129
-
130
-
131
-
132
-
133
-
134
-
135
-
136
-
137
-
138
-
139
-
140
-
141
-
142
-
143
-
144
-
145
-
146
-
147
-
148
-
149
-
150
-
151
-
152
-
153
-
154
-
155
-
156
-
157
-
158
-
159
-
160
-
161
-
162
-
163
-
164
-
165
-
166
-
167
-
168
-
169
-
170
-
171
-
172
-
173
-
174
-
175
-
176
-
177
-
178
-
179
-
180
-
181
-
182
-
 183
183 -
 184
184 -
 185
185 -
 186
186 -
 187
187 -
 188
188 -
 189
189 -
 190
190 -
 191
191 -
 192
192 -
 193
193 -
 194
194 -
 195
195 -
 196
196 -
 197
197 -
 198
198 -
 199
199 -
 200
200
 |
 |

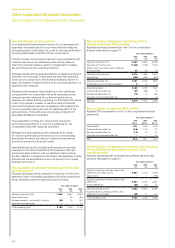
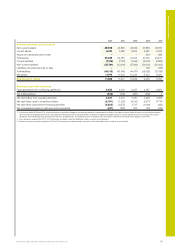
2015 2014 201312012120111
Summary statement of net assets
Non-current assets 49,058 44,895 4 5,129 41,684 39,787
Current assets 6,031 7, 4 8 9 9,576 5,387 6,323
Assets of businesses held for sale –– – 264 290
Total assets 55,089 52,384 54,705 47, 3 3 5 46,400
Current liabilities ( 7,374) ( 7, 3 31) ( 7, 4 4 5) (6,004) (6,826)
Non-current liabilities (35,741) (33,134) ( 37,026 ) (32,001) (30,403)
Liabilities of businesses held for sale –– – (87) (110)
Total liabilities (4 3,115) (40,465) (44,471) (38,092) ( 37, 3 3 9 )
Net assets 11,974 11,919 10,234 9,243 9,061
Shareholders’ equity 11,962 11,911 10,229 9,236 9,052
Summary cash flow statement
Cash generated from continuing operations 5,350 4,419 4,037 4,487 4,854
Tax (paid)/received (343) (400) (287) (259) 4
Net cash inflow from operating activities 5,007 4,019 3,750 4,228 4,858
Net cash flows used in investing activities (2,001) (1,330) (6,13 0) (2,371) (4,774)
Net cash flows (used in)/from financing activities (3,253) (2,972) 2,715 (1,900) (430)
Net (decrease)/increase in cash and cash equivalents (247) (283) 335 (43) (346)
1. For the year ended 31 March 2015, there have been no significant changes in accounting standards, interpretations or policies that have a material financial impact on the selected financial
data. For the year ended 31 March 2014, the adoption of IAS 19 (revised) ‘Employee benefits’ resulted in a significant change in pensions and employee benefits accounting. The numbers
included in the selected financial data above for the years 31 March 2011, 2012 and 2013 were restated to show the impact of IAS 19 (revised) had it been adopted since 2010.
2. Items previously reported for 2011 to 2014 have been restated to reflect the additional shares issued as scrip dividends.
3. Number of shares previously reported for 2011 to 2014 have been restated to reflect the impact of the additional shares issued as scrip dividends.
Additional Information
NATIONAL GRID ANNUAL REPORT AND ACCOUNTS 2014/15 191