National Grid 2015 Annual Report Download - page 125
Download and view the complete annual report
Please find page 125 of the 2015 National Grid annual report below. You can navigate through the pages in the report by either clicking on the pages listed below, or by using the keyword search tool below to find specific information within the annual report.-
 1
1 -
2
-
3
-
4
-
5
-
6
-
7
-
8
-
9
-
10
-
11
-
12
-
13
-
14
-
15
-
16
-
17
-
18
-
19
-
20
-
21
-
22
-
23
-
24
-
25
-
26
-
27
-
28
-
29
-
30
-
31
-
32
-
33
-
34
-
35
-
36
-
37
-
38
-
39
-
40
-
41
-
42
-
43
-
44
-
45
-
46
-
47
-
48
-
49
-
50
-
51
-
52
-
53
-
54
-
55
-
56
-
57
-
58
-
59
-
60
-
61
-
62
-
63
-
64
-
65
-
66
-
67
-
68
-
69
-
70
-
71
-
72
-
73
-
74
-
75
-
76
-
77
-
78
-
79
-
80
-
81
-
82
-
83
-
84
-
85
-
86
-
87
-
88
-
89
-
90
-
91
-
92
-
93
-
94
-
95
-
96
-
97
-
98
-
99
-
100
-
101
-
102
-
103
-
104
-
105
-
106
-
107
-
108
-
109
-
110
-
111
-
112
-
113
-
114
-
 115
115 -
 116
116 -
 117
117 -
 118
118 -
 119
119 -
 120
120 -
 121
121 -
 122
122 -
 123
123 -
 124
124 -
 125
125 -
 126
126 -
 127
127 -
 128
128 -
 129
129 -
 130
130 -
 131
131 -
 132
132 -
 133
133 -
 134
134 -
 135
135 -
136
-
137
-
138
-
139
-
140
-
141
-
142
-
143
-
144
-
145
-
146
-
147
-
148
-
149
-
150
-
151
-
152
-
153
-
154
-
155
-
156
-
157
-
158
-
159
-
160
-
161
-
162
-
163
-
164
-
165
-
166
-
167
-
168
-
169
-
170
-
171
-
172
-
173
-
174
-
175
-
176
-
177
-
178
-
179
-
180
-
181
-
182
-
183
-
184
-
185
-
186
-
187
-
188
-
189
-
190
-
191
-
192
-
193
-
194
-
195
-
196
-
197
-
198
-
199
-
200
 |
 |

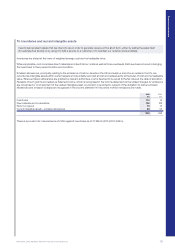
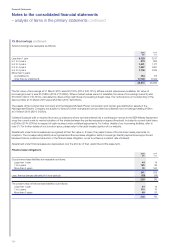
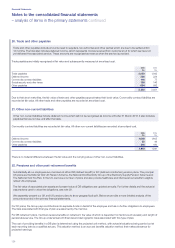
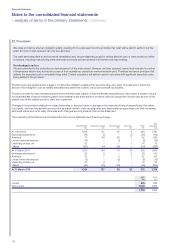
18. Cash and cash equivalents
Cash and cash equivalents include cash balances, together with short-term investments with an original maturity of less than three
months that are readily convertible to cash.
Net cash and cash equivalents reflected in the cash flow statement are net of bank overdrafts, which are reported in borrowings. The carrying
amounts of cash and cash equivalents and bank overdrafts approximate their fair values.
Cash at bank earns interest at floating rates based on daily bank deposit rates. Short-term deposits are made for periods varying between
one day and three months, depending on the immediate cash requirements, and earn interest at the respective short-term deposit rates.
Net cash and cash equivalents held in currencies other than sterling have been converted into sterling at year-end exchange rates. For further
information on currency exposures, refer to note 30(d).
2015
£m
2014
£m
Cash at bank 109 75
Short-term deposits 10 279
Cash and cash equivalents excluding bank overdrafts 119 354
Bank overdrafts (3) (15)
Net cash and cash equivalents 116 339
At 31 March 2015, £1m (2014: £24m) of cash and cash equivalents were restricted. This primarily relates to cash held in captive
insurancecompanies.
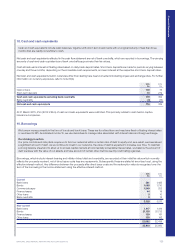
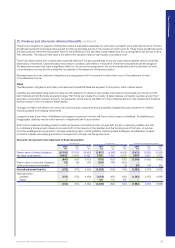
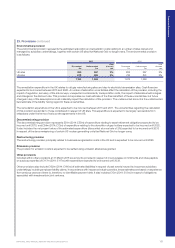
19. Borrowings
We borrow money primarily in the form of bonds and bank loans. These are for a fixed term and may have fixed or floating interest rates
or are linked to RPI. As indicated in note 15, we use derivatives to manage risks associated with interest rates and foreign exchange.
Our strategy in action
Our price controls and rate plans require us to fund our networks within a certain ratio of debt to equity and, as a result, we have issued
a significant amount of debt. As we continue to invest in our networks, the value of debt is expected to increase over time. To maintain
a strong balance sheet and to allow us to access capital markets at commercially acceptable interest rates, we balance the amount of
debt we issue with the value of our assets, and take account of certain other metrics used by credit rating agencies.
Borrowings, which include interest-bearing and inflation linked debt and overdrafts, are recorded at their initial fair value which normally
reflects the proceeds received, net of direct issue costs less any repayments. Subsequently these are stated at amortised cost, using the
effective interest method. Any difference between the proceeds after direct issue costs and the redemption value is recognised over the
term of the borrowing in the income statement using the effective interest method.
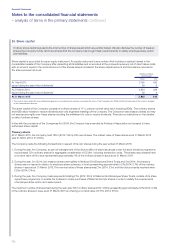
2015
£m
2014
£m
Current
Bank loans 561 1,485
Bonds 1,068 1,730
Commercial paper 1,349 252
Finance leases 44 19
Other loans 310
Bank overdrafts 315
3,028 3,511
Non-current
Bank loans 1,417 1,414
Bonds 21,156 20,732
Finance leases 159 151
Other loans 150 142
22,882 22,439
25,910 25,950
Financial Statements
NATIONAL GRID ANNUAL REPORT AND ACCOUNTS 2014/15 123