National Grid 2015 Annual Report Download - page 89
Download and view the complete annual report
Please find page 89 of the 2015 National Grid annual report below. You can navigate through the pages in the report by either clicking on the pages listed below, or by using the keyword search tool below to find specific information within the annual report.-
 1
1 -
2
-
3
-
4
-
5
-
6
-
7
-
8
-
9
-
10
-
11
-
12
-
13
-
14
-
15
-
16
-
17
-
18
-
19
-
20
-
21
-
22
-
23
-
24
-
25
-
26
-
27
-
28
-
29
-
30
-
31
-
32
-
33
-
34
-
35
-
36
-
37
-
38
-
39
-
40
-
41
-
42
-
43
-
44
-
45
-
46
-
47
-
48
-
49
-
50
-
51
-
52
-
53
-
54
-
55
-
56
-
57
-
58
-
59
-
60
-
61
-
62
-
63
-
64
-
65
-
66
-
67
-
68
-
69
-
70
-
71
-
72
-
73
-
74
-
75
-
76
-
77
-
78
-
 79
79 -
 80
80 -
 81
81 -
 82
82 -
 83
83 -
 84
84 -
 85
85 -
 86
86 -
 87
87 -
 88
88 -
 89
89 -
 90
90 -
 91
91 -
 92
92 -
 93
93 -
 94
94 -
 95
95 -
 96
96 -
 97
97 -
 98
98 -
 99
99 -
100
-
101
-
102
-
103
-
104
-
105
-
106
-
107
-
108
-
109
-
110
-
111
-
112
-
113
-
114
-
115
-
116
-
117
-
118
-
119
-
120
-
121
-
122
-
123
-
124
-
125
-
126
-
127
-
128
-
129
-
130
-
131
-
132
-
133
-
134
-
135
-
136
-
137
-
138
-
139
-
140
-
141
-
142
-
143
-
144
-
145
-
146
-
147
-
148
-
149
-
150
-
151
-
152
-
153
-
154
-
155
-
156
-
157
-
158
-
159
-
160
-
161
-
162
-
163
-
164
-
165
-
166
-
167
-
168
-
169
-
170
-
171
-
172
-
173
-
174
-
175
-
176
-
177
-
178
-
179
-
180
-
181
-
182
-
183
-
184
-
185
-
186
-
187
-
188
-
189
-
190
-
191
-
192
-
193
-
194
-
195
-
196
-
197
-
198
-
199
-
200
 |
 |

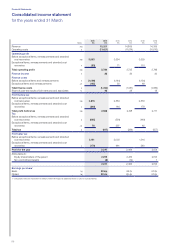
Unaudited commentary on the consolidated incomestatement
The consolidated income statement shows all revenue earned
and costs incurred in the year, with the difference being the
overall profit for the year.
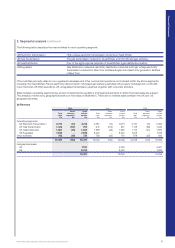
Revenue
Revenue for the year ended 31 March 2015 increased by £392m
to £15,201m. This increase was driven by higher revenues in our
UK Electricity Transmission business, reflecting increases in
allowed Transmission Owner revenues, and higher core allowances
and pass-through costs in UK Gas Transmission. Revenues in our
UK Gas Distribution business were slightly lower as a result of
changes inallowed revenues for replacement expenditure (repex).
Our US Regulated businesses revenues were also lower, as a
result of the end of the LIPA Management Services Agreement
(MSA) last year, partially offset by revenue increases from existing
rate plans, including capex trackers, together with additional
income from gas customer growth and the impact of the
strengthening US dollar.
Operating costs
Operating costs for the year ended 31 March 2015 of £11,421m
were £347m higher than the prior year. This increase in costs
included a £154m year on year impact of changes in exceptional
items, remeasurements and stranded cost recoveries, which is
discussed below. Excluding exceptional items, remeasurements
and stranded cost recoveries, operating costs were £193m higher,
principally due to: increases in controllable costs, including the
impact of inflation and additional costs incurred in the US to
improve data quality and bring regulatory filings up to date; higher
US bad debt costs following last year’s exceptionally cold winter;
and higher depreciation and amortisation as a result of continued
investment programmes. These cost increases were partly offset
by a reduction in spend on US financial systems implementation
and stabilisation upgrades, with the project completing in the first
half of this year.
Net finance costs
For the year ended 31 March 2015, net finance costs before
exceptional items and remeasurements were £75m lower than
2013/14 at £1,033m, mainly as a result of lower average gross
debt through the year, lower RPI in the UK and refinancing debt
atlower rates.
Tax
The tax charge on profit before exceptional items, remeasurements
and stranded cost recoveries was £114m higher than 2013/14.
This was mainly due to higher profits before tax and the non-
recurrence of one-off items that benefited the prior year.
Exceptional items, remeasurements and stranded
cost recoveries
Operating profit for the year ended 31 March 2015 included an
£83m loss (2013/14: £16m gain) on remeasurement of commodity
contracts. The year ended 31 March 2014 also included a net
£55m gain on exceptional items, including a net gain on the LIPA
MSA transition in the US of £254m; restructuring costs of £136m,
primarily in the UK as we reorganised certain parts of our business
to deliver under the new RIIO price controls; and a £79m provision
for the demolition of UK gas holders that are no longer required.
Finance costs for the year ended 31 March 2015 included
exceptional debt redemption costs of £131m and a loss of £34m
on financial remeasurements, relating to net losses on derivative
financial instruments.
Exceptional tax for 2014/15 of £78m primarily represents tax credits
on the exceptional items and remeasurements described above.
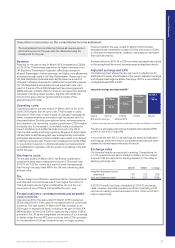
Adjusted earnings and EPS
The following chart shows the five year trend in adjusted profit
attributable to equity shareholders of the parent (adjusted earnings)
and adjusted earnings per share. See page 186 for a reconciliation
of adjusted basic EPS to EPS.
£1,627m£1,709m
2011/12
201
0/11 2012/13 2013/14 2014/15
£1,913m£2,015m £2,189m
44.9p 45.5p
50.9p
53.5p
58.1p
Adjusted earnings and adjusted EPS1
Adjusted EPSAdjusted earnings
1. Adjusted earnings and adjusted EPS are attributable to equity shareholders of the parent.
The above earnings performance translated into adjusted EPS
growth in 2014/15 of 4.6p (9%).
In accordance with IAS 33, all earnings per share and adjusted
earnings per share amounts for comparative periods have been
restated for shares issued via scrip dividends.
Exchange rates
Our financial results are reported in sterling. Transactions for
ourUS operations are denominated in dollars, so the related
amounts that are reported in sterling depend on the dollar to
sterling exchange rate.
2014/15 2013/14 % change
Weighted average (income
statement) 1.58 1.62 (2)%
Year end (balance sheet) 1.49 1.67 (11)%
If 2013/14 results had been translated at 2014/15 exchange
rates, revenue, adjusted operating profit and operating profit
reported in sterling would have been £212m, £25m and £32m
higher respectively.
Financial Statements
NATIONAL GRID ANNUAL REPORT AND ACCOUNTS 2014/15 87