National Grid 2015 Annual Report Download - page 128
Download and view the complete annual report
Please find page 128 of the 2015 National Grid annual report below. You can navigate through the pages in the report by either clicking on the pages listed below, or by using the keyword search tool below to find specific information within the annual report.-
 1
1 -
2
-
3
-
4
-
5
-
6
-
7
-
8
-
9
-
10
-
11
-
12
-
13
-
14
-
15
-
16
-
17
-
18
-
19
-
20
-
21
-
22
-
23
-
24
-
25
-
26
-
27
-
28
-
29
-
30
-
31
-
32
-
33
-
34
-
35
-
36
-
37
-
38
-
39
-
40
-
41
-
42
-
43
-
44
-
45
-
46
-
47
-
48
-
49
-
50
-
51
-
52
-
53
-
54
-
55
-
56
-
57
-
58
-
59
-
60
-
61
-
62
-
63
-
64
-
65
-
66
-
67
-
68
-
69
-
70
-
71
-
72
-
73
-
74
-
75
-
76
-
77
-
78
-
79
-
80
-
81
-
82
-
83
-
84
-
85
-
86
-
87
-
88
-
89
-
90
-
91
-
92
-
93
-
94
-
95
-
96
-
97
-
98
-
99
-
100
-
101
-
102
-
103
-
104
-
105
-
106
-
107
-
108
-
109
-
110
-
111
-
112
-
113
-
114
-
115
-
116
-
117
-
 118
118 -
 119
119 -
 120
120 -
 121
121 -
 122
122 -
 123
123 -
 124
124 -
 125
125 -
 126
126 -
 127
127 -
 128
128 -
 129
129 -
 130
130 -
 131
131 -
 132
132 -
 133
133 -
 134
134 -
 135
135 -
 136
136 -
 137
137 -
 138
138 -
139
-
140
-
141
-
142
-
143
-
144
-
145
-
146
-
147
-
148
-
149
-
150
-
151
-
152
-
153
-
154
-
155
-
156
-
157
-
158
-
159
-
160
-
161
-
162
-
163
-
164
-
165
-
166
-
167
-
168
-
169
-
170
-
171
-
172
-
173
-
174
-
175
-
176
-
177
-
178
-
179
-
180
-
181
-
182
-
183
-
184
-
185
-
186
-
187
-
188
-
189
-
190
-
191
-
192
-
193
-
194
-
195
-
196
-
197
-
198
-
199
-
200
 |
 |

Financial Statements
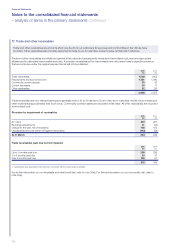
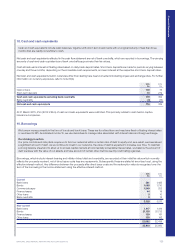
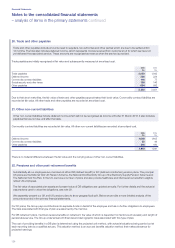
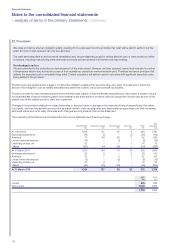
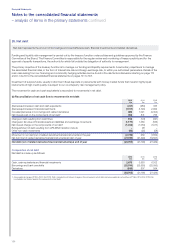
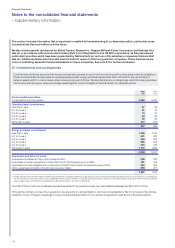
20. Trade and other payables
Trade and other payables include amounts owed to suppliers, tax authorities and other parties which are due to be settled within
12months. The total also includes deferred income, which represents monies received from customers but for which we have not
yetdelivered the associated service. These amounts are recognised as revenue when the service is provided.
Trade payables are initially recognised at fair value and subsequently measured at amortised cost.
2015
£m
2014
£m
Trade payables 2,050 1,942
Deferred income 236 224
Commodity contract liabilities 116 77
Social security and other taxes 196 146
Other payables 694 642
3,292 3,031
Due to their short maturities, the fair value of trade and other payables approximates their book value. Commodity contract liabilities are
recorded at fair value. All other trade and other payables are recorded at amortised cost.
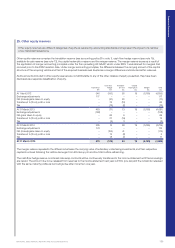
21. Other non-current liabilities
Other non-current liabilities include deferred income which will not be recognised as income until after 31 March 2016. It also includes
payables that are not due until after that date.
Commodity contract liabilities are recorded at fair value. All other non-current liabilities are recorded at amortised cost.
2015
£m
2014
£m
Deferred income 1,648 1,605
Commodity contract liabilities 55 46
Other payables 216 190
1,919 1,841
There is no material difference between the fair value and the carrying value of other non-current liabilities.
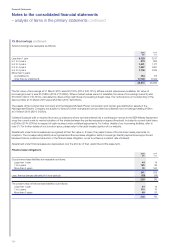
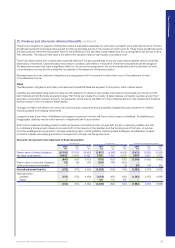
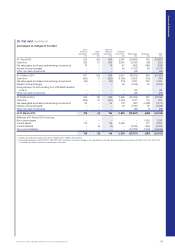
22. Pensions and other post-retirement benefits
Substantially all our employees are members of either DB (defined benefit) or DC (defined contribution) pension plans. The principal
UKplans are the National Grid UK Pension Scheme, the National Grid Electricity Group of the Electricity Supply Pension Scheme and
The National Grid YouPlan. In the US, we have a number of plans and also provide healthcare and life insurance benefits to eligible
retired US employees.
The fair value of associated plan assets and present value of DB obligations are updated annually. For further details and the actuarial
assumptions used to value the obligations, see note 29.
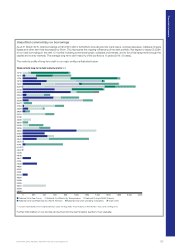
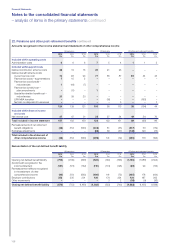
We separately present our UK and US pension plans to show geographical split. Below we provide a more detailed analysis of the
amounts recorded in the primary financial statements.
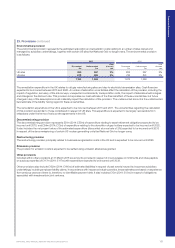
For DC plans, the Group pays contributions into separate funds on behalf of the employee and has no further obligations to employees.
The risks associated with this type of plan are assumed by the member.
For DB retirement plans, members receive benefits on retirement, the value of which is dependent on factors such as salary and length of
pensionable service. The Group underwrites both financial and demographic risks associated with this type of plan.
The cost of providing benefits in a DB plan is determined using the projected unit method, with actuarial valuations being carried out at
each reporting date by a qualified actuary. This valuation method is an accrued benefits valuation method that makes allowance for
projected earnings.
– analysis of items in the primary statements continued
Notes to the consolidated financial statements
126