National Grid 2015 Annual Report Download - page 137
Download and view the complete annual report
Please find page 137 of the 2015 National Grid annual report below. You can navigate through the pages in the report by either clicking on the pages listed below, or by using the keyword search tool below to find specific information within the annual report.-
 1
1 -
2
-
3
-
4
-
5
-
6
-
7
-
8
-
9
-
10
-
11
-
12
-
13
-
14
-
15
-
16
-
17
-
18
-
19
-
20
-
21
-
22
-
23
-
24
-
25
-
26
-
27
-
28
-
29
-
30
-
31
-
32
-
33
-
34
-
35
-
36
-
37
-
38
-
39
-
40
-
41
-
42
-
43
-
44
-
45
-
46
-
47
-
48
-
49
-
50
-
51
-
52
-
53
-
54
-
55
-
56
-
57
-
58
-
59
-
60
-
61
-
62
-
63
-
64
-
65
-
66
-
67
-
68
-
69
-
70
-
71
-
72
-
73
-
74
-
75
-
76
-
77
-
78
-
79
-
80
-
81
-
82
-
83
-
84
-
85
-
86
-
87
-
88
-
89
-
90
-
91
-
92
-
93
-
94
-
95
-
96
-
97
-
98
-
99
-
100
-
101
-
102
-
103
-
104
-
105
-
106
-
107
-
108
-
109
-
110
-
111
-
112
-
113
-
114
-
115
-
116
-
117
-
118
-
119
-
120
-
121
-
122
-
123
-
124
-
125
-
126
-
 127
127 -
 128
128 -
 129
129 -
 130
130 -
 131
131 -
 132
132 -
 133
133 -
 134
134 -
 135
135 -
 136
136 -
 137
137 -
 138
138 -
 139
139 -
 140
140 -
 141
141 -
 142
142 -
 143
143 -
 144
144 -
 145
145 -
 146
146 -
 147
147 -
148
-
149
-
150
-
151
-
152
-
153
-
154
-
155
-
156
-
157
-
158
-
159
-
160
-
161
-
162
-
163
-
164
-
165
-
166
-
167
-
168
-
169
-
170
-
171
-
172
-
173
-
174
-
175
-
176
-
177
-
178
-
179
-
180
-
181
-
182
-
183
-
184
-
185
-
186
-
187
-
188
-
189
-
190
-
191
-
192
-
193
-
194
-
195
-
196
-
197
-
198
-
199
-
200
 |
 |

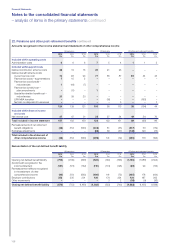
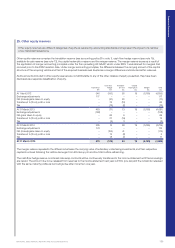
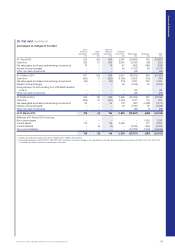
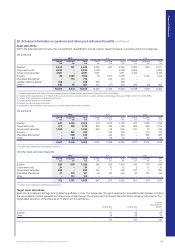
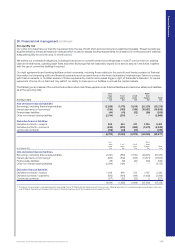
26. Net debt continued
(b) Analysis of changes in net debt
Cash
and cash
equivalents
£m
Bank
overdrafts
£m
Net cash
and cash
equivalents
£m
Financial
investments
£m
Borrowings
£m
Derivatives
£m
Total1
£m
At 1 April 2012 332 (33) 299 2,391 (22,992) 705 (19,597)
Cash flow 325 10 335 2,963 (3,433) (86) (221)
Fair value gains and losses and exchange movements 14 –14 47 (452) (145) (536)
Interest income/(charges) – – – 30 (1,137 ) 90 (1,017)
Other non-cash movements – – – – (58) –(58)
At 31 March 2013 671 (23) 648 5,431 (28,072) 564 (21,429)
Cash flow (291) 8(283) (1,755) 2,009 (112) (141)
Fair value gains and losses and exchange movements (26) –(26) (113) 1,223 276 1,360
Interest income/(charges) –––36 (1,168) 79 (1,053)
Extinguishment of debt resulting from LIPA MSA transition
(note 4) ––––98 –98
Other non-cash movements – – – – (25) –(25)
At 31 March 2014 354 (15) 339 3,599 (25,935) 807 (21,19 0 )
Cash flow (259) 12 (247) (1,194) 1,721 (77) 203
Fair value gains and losses and exchange movements 24 –24 118 (451) (1,468) (1,777)
Interest income/(charges)2–––36 (1,160) 56 (1,068)
Other non-cash movements ––––(82) (1) (83)
At 31 March 2015 119 (3) 116 2,559 (25,907) (683) (23,915)
Balances at 31 March 2015 comprise:
Non-current assets –––––1,539 1,539
Current assets 119 –119 2,559 –177 2,855
Current liabilities –(3) (3) –(3,025) (635) (3,663)
Non-current liabilities ––––(22,882) (1,764) (24,646)
119 (3) 116 2,559 (25,907) (683) (23,915)
1. Includes accrued interest at 31 March 2015 of £230m (2014: £239m; 2013: £250m).
2. An exceptional expense of £131m (2014: £nil; 2013: £nil) is included in net interest charge on the components of net debt and an exceptional cash outflow of £152m (2014: £nil; 2013: £nil)
isincluded in net interest paid on the components of net debt.
Financial Statements
NATIONAL GRID ANNUAL REPORT AND ACCOUNTS 2014/15 135