National Grid 2015 Annual Report Download - page 115
Download and view the complete annual report
Please find page 115 of the 2015 National Grid annual report below. You can navigate through the pages in the report by either clicking on the pages listed below, or by using the keyword search tool below to find specific information within the annual report.-
 1
1 -
2
-
3
-
4
-
5
-
6
-
7
-
8
-
9
-
10
-
11
-
12
-
13
-
14
-
15
-
16
-
17
-
18
-
19
-
20
-
21
-
22
-
23
-
24
-
25
-
26
-
27
-
28
-
29
-
30
-
31
-
32
-
33
-
34
-
35
-
36
-
37
-
38
-
39
-
40
-
41
-
42
-
43
-
44
-
45
-
46
-
47
-
48
-
49
-
50
-
51
-
52
-
53
-
54
-
55
-
56
-
57
-
58
-
59
-
60
-
61
-
62
-
63
-
64
-
65
-
66
-
67
-
68
-
69
-
70
-
71
-
72
-
73
-
74
-
75
-
76
-
77
-
78
-
79
-
80
-
81
-
82
-
83
-
84
-
85
-
86
-
87
-
88
-
89
-
90
-
91
-
92
-
93
-
94
-
95
-
96
-
97
-
98
-
99
-
100
-
101
-
102
-
103
-
104
-
 105
105 -
 106
106 -
 107
107 -
 108
108 -
 109
109 -
 110
110 -
 111
111 -
 112
112 -
 113
113 -
 114
114 -
 115
115 -
 116
116 -
 117
117 -
 118
118 -
 119
119 -
 120
120 -
 121
121 -
 122
122 -
 123
123 -
 124
124 -
 125
125 -
126
-
127
-
128
-
129
-
130
-
131
-
132
-
133
-
134
-
135
-
136
-
137
-
138
-
139
-
140
-
141
-
142
-
143
-
144
-
145
-
146
-
147
-
148
-
149
-
150
-
151
-
152
-
153
-
154
-
155
-
156
-
157
-
158
-
159
-
160
-
161
-
162
-
163
-
164
-
165
-
166
-
167
-
168
-
169
-
170
-
171
-
172
-
173
-
174
-
175
-
176
-
177
-
178
-
179
-
180
-
181
-
182
-
183
-
184
-
185
-
186
-
187
-
188
-
189
-
190
-
191
-
192
-
193
-
194
-
195
-
196
-
197
-
198
-
199
-
200
 |
 |

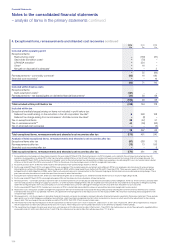
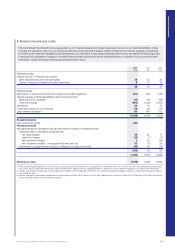
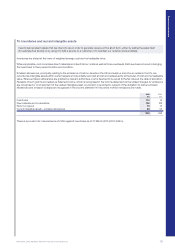
9. Goodwill
Goodwill represents the excess of what we paid to acquire businesses over the fair value of their net assets at the acquisition date.
Weassess whether goodwill is recoverable each year by performing an impairment review.
Goodwill is recognised as an asset and is not amortised, but is tested for impairment annually or more frequently if events or changes
incircumstances indicate a potential impairment. Any impairment is recognised immediately in the income statement and is not
subsequently reversed.
Goodwill and fair value adjustments arising on the acquisition of a foreign entity are treated as assets and liabilities of the foreign entity
andtranslated at the closing exchange rate.
Impairment
Goodwill is allocated to cash-generating units and this allocation is made to those cash-generating units that are expected to benefit from
the business combination in which the goodwill arose.
Impairments of goodwill are calculated as the difference between the carrying value of the goodwill and the estimated recoverable amount
of the cash-generating unit to which that goodwill has been allocated. Recoverable amount is defined as the higher of fair value less costs
to sell and estimated value-in-use at the date the impairment review is undertaken.
Value-in-use represents the present value of expected future cash flows, discounted using a pre-tax discount rate that reflects current
market assessments of the time value of money and the risks specific to the asset for which the estimates of future cash flows have not
been adjusted.
Impairments are recognised in the income statement and are disclosed separately.
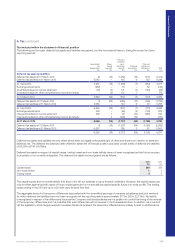
Total
£m
Net book value at 1 April 2013 5,028
Additions 12
Exchange adjustments (446)
Net book value at 31 March 2014 4,594
Impairment (12)
Exchange adjustments 563
Net book value at 31 March 2015 5,145
The cost of goodwill at 31 March 2015 was £5,157m (2014: £4,594m) with an accumulated impairment charge of £12m (2014: £nil).
The amounts disclosed above as at 31 March 2015 include balances relating to the following cash-generating units: New York £2,964m
(2014:£2,640m); Massachusetts £1,108m (2014: £987m); Rhode Island £412m (2014: £367m); and Federal £661m (2014: £600m).
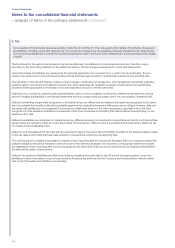
Goodwill is reviewed annually for impairment and the recoverability of goodwill has been assessed by comparing the carrying amount
ofour operations described above (our cash-generating units) with the expected recoverable amount on a value-in-use basis. In each
assessment, the value-in-use has been calculated based on five year plan projections that incorporate our best estimates of future cash
flows, customer rates, costs, future prices and growth. Such projections reflect our current regulatory rate plans taking into account
regulatory arrangements to allow for future rate plan filings and recovery of investment. Our plans have proved to be reliable guides in
thepast and the Directors believe the estimates are appropriate.
The future economic growth rate used to extrapolate projections beyond five years has been maintained at 2.25% (2014: 2.25%). The
growth rate hasbeen determined having regard to data on projected growth in US real gross domestic product (GDP). Based on our
business’ place in the underlying US economy, it is appropriate for the terminal growth rate to be based upon the overall growth in real
GDP and, given thenature of our operations, to extend over a long period of time. Cash flow projections have been discounted to reflect
the time value ofmoney, using a pre-tax discount rate of 9% (2014: 9%). The discount rate represents the estimated weighted average
cost ofcapital of these operations.
While it is possible that a key assumption in the calculation could change, the Directors believe that no reasonably foreseeable change
would result in an impairment of goodwill, in view of the long-term nature of the key assumptions and the margin by which the estimated
fair value exceeds the carrying amount.
As part of their review, the Directors specifically reviewed the carrying value of goodwill associated with Clean Line Energy Partners LLC.
This review resulted in a full impairment being recorded of £12m.
Financial Statements
NATIONAL GRID ANNUAL REPORT AND ACCOUNTS 2014/15 113