National Grid 2015 Annual Report Download - page 142
Download and view the complete annual report
Please find page 142 of the 2015 National Grid annual report below. You can navigate through the pages in the report by either clicking on the pages listed below, or by using the keyword search tool below to find specific information within the annual report.-
 1
1 -
2
-
3
-
4
-
5
-
6
-
7
-
8
-
9
-
10
-
11
-
12
-
13
-
14
-
15
-
16
-
17
-
18
-
19
-
20
-
21
-
22
-
23
-
24
-
25
-
26
-
27
-
28
-
29
-
30
-
31
-
32
-
33
-
34
-
35
-
36
-
37
-
38
-
39
-
40
-
41
-
42
-
43
-
44
-
45
-
46
-
47
-
48
-
49
-
50
-
51
-
52
-
53
-
54
-
55
-
56
-
57
-
58
-
59
-
60
-
61
-
62
-
63
-
64
-
65
-
66
-
67
-
68
-
69
-
70
-
71
-
72
-
73
-
74
-
75
-
76
-
77
-
78
-
79
-
80
-
81
-
82
-
83
-
84
-
85
-
86
-
87
-
88
-
89
-
90
-
91
-
92
-
93
-
94
-
95
-
96
-
97
-
98
-
99
-
100
-
101
-
102
-
103
-
104
-
105
-
106
-
107
-
108
-
109
-
110
-
111
-
112
-
113
-
114
-
115
-
116
-
117
-
118
-
119
-
120
-
121
-
122
-
123
-
124
-
125
-
126
-
127
-
128
-
129
-
130
-
131
-
 132
132 -
 133
133 -
 134
134 -
 135
135 -
 136
136 -
 137
137 -
 138
138 -
 139
139 -
 140
140 -
 141
141 -
 142
142 -
 143
143 -
 144
144 -
 145
145 -
 146
146 -
 147
147 -
 148
148 -
 149
149 -
 150
150 -
 151
151 -
 152
152 -
153
-
154
-
155
-
156
-
157
-
158
-
159
-
160
-
161
-
162
-
163
-
164
-
165
-
166
-
167
-
168
-
169
-
170
-
171
-
172
-
173
-
174
-
175
-
176
-
177
-
178
-
179
-
180
-
181
-
182
-
183
-
184
-
185
-
186
-
187
-
188
-
189
-
190
-
191
-
192
-
193
-
194
-
195
-
196
-
197
-
198
-
199
-
200
 |
 |

Financial Statements
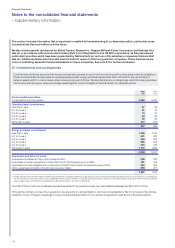
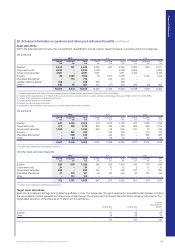
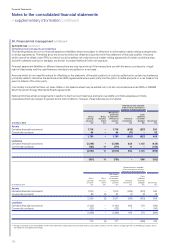
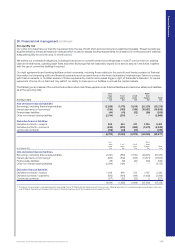
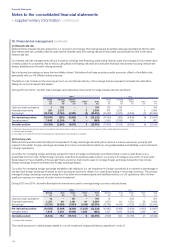
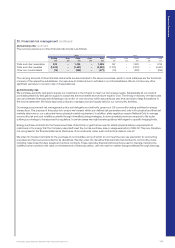
29. Actuarial information on pensions and other post-retirement benefits continued
Actuarial assumptions
The Company has applied the following financial assumptions in assessing DB liabilities.
UK pensions US pensions US other post-retirement benefits
2015
%
2014
%
2013
%
2015
%
2014
%
2013
%
2015
%
2014
%
2013
%
Discount rate13.3 4.3 4.3 4.1 4.8 4.7 4.1 4.8 4.7
Rate of increase in salaries23.2 3.6 4.1 3.5 3.5 3.5 3.5 3.5 3.5
Rate of increase in RPI32.9 3.3 3.4 n/a n/a n/a n/a n/a n/a
Initial healthcare cost trend rate n/a n/a n/a n/a n/a n/a 8.0 8.0 8.0
Ultimate healthcare cost trend rate n/a n/a n/a n/a n/a n/a 5.0 5.0 5.0
1. The discount rates for pension liabilities have been determined by reference to appropriate yields on high-quality corporate bonds prevailing in the UK and US debt markets at the
reportingdate.
2. A promotional scale has also been used where appropriate. The UK assumption stated is that relating to service prior to 1 April 2014. The UK assumption for the rate of increase in salaries
forservice after this date is 2.1%.
3. This is the key assumption that determines assumed increases in pensions in payment and deferment in the UK only. The assumptions for the UK were 2.9% (2014: 3.3%; 2013: 3.4%) for
increases in pensions in payment and 2.1% (2014: 3.3%; 2013: 3.4%) for increases in pensions in deferment.
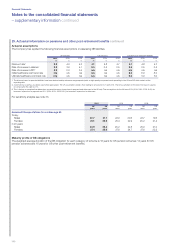
For sensitivity analysis see note 33.
2015 2014 2013
UK
years
US
years
UK
years
US
years
UK
years
US
years
Assumed life expectations for a retiree age 65
Today:
Males 22.7 21.7 22.9 20.6 22.7 19.5
Females 25.1 23.9 25.4 22.9 25.2 21.4
In 20 years:
Males 24.9 23.4 25.2 22.8 25.0 21.0
Females 27.4 25.6 27.8 24.7 27.6 22.2
Maturity profile of DB obligations
The weighted average duration of the DB obligation for each category of scheme is 16 years for UK pension schemes; 14 years for US
pension schemes and 18 years for US other post-retirement benefits.
– supplementary information continued
Notes to the consolidated financial statements
140